


Understanding your business performance starts with clear, actionable insights. LMN’s Analytics section provides dashboards that give visibility into estimates, jobs, staff, and invoices. Knowing what each dashboard tracks and how to use the data can help make smarter decisions, optimize workflows, and spot opportunities for improvement.
This guide walks through the four main dashboard categories in LMN, showing what each offers and how to interpret the insights.
Understanding the Four Dashboard Categories
LMN includes four dashboard categories, each focused on a different aspect of operations:
1. Estimates – Tracks salesperson activity and estimate performance.
2. Jobs – Provides insights into job costs and performance metrics.
3. Staff – Monitors crew activity and effectiveness.
4. Invoices – Gives an overview of invoicing status and balances.
Using the dashboards correctly ensures data is actionable and helps teams stay aligned with goals.
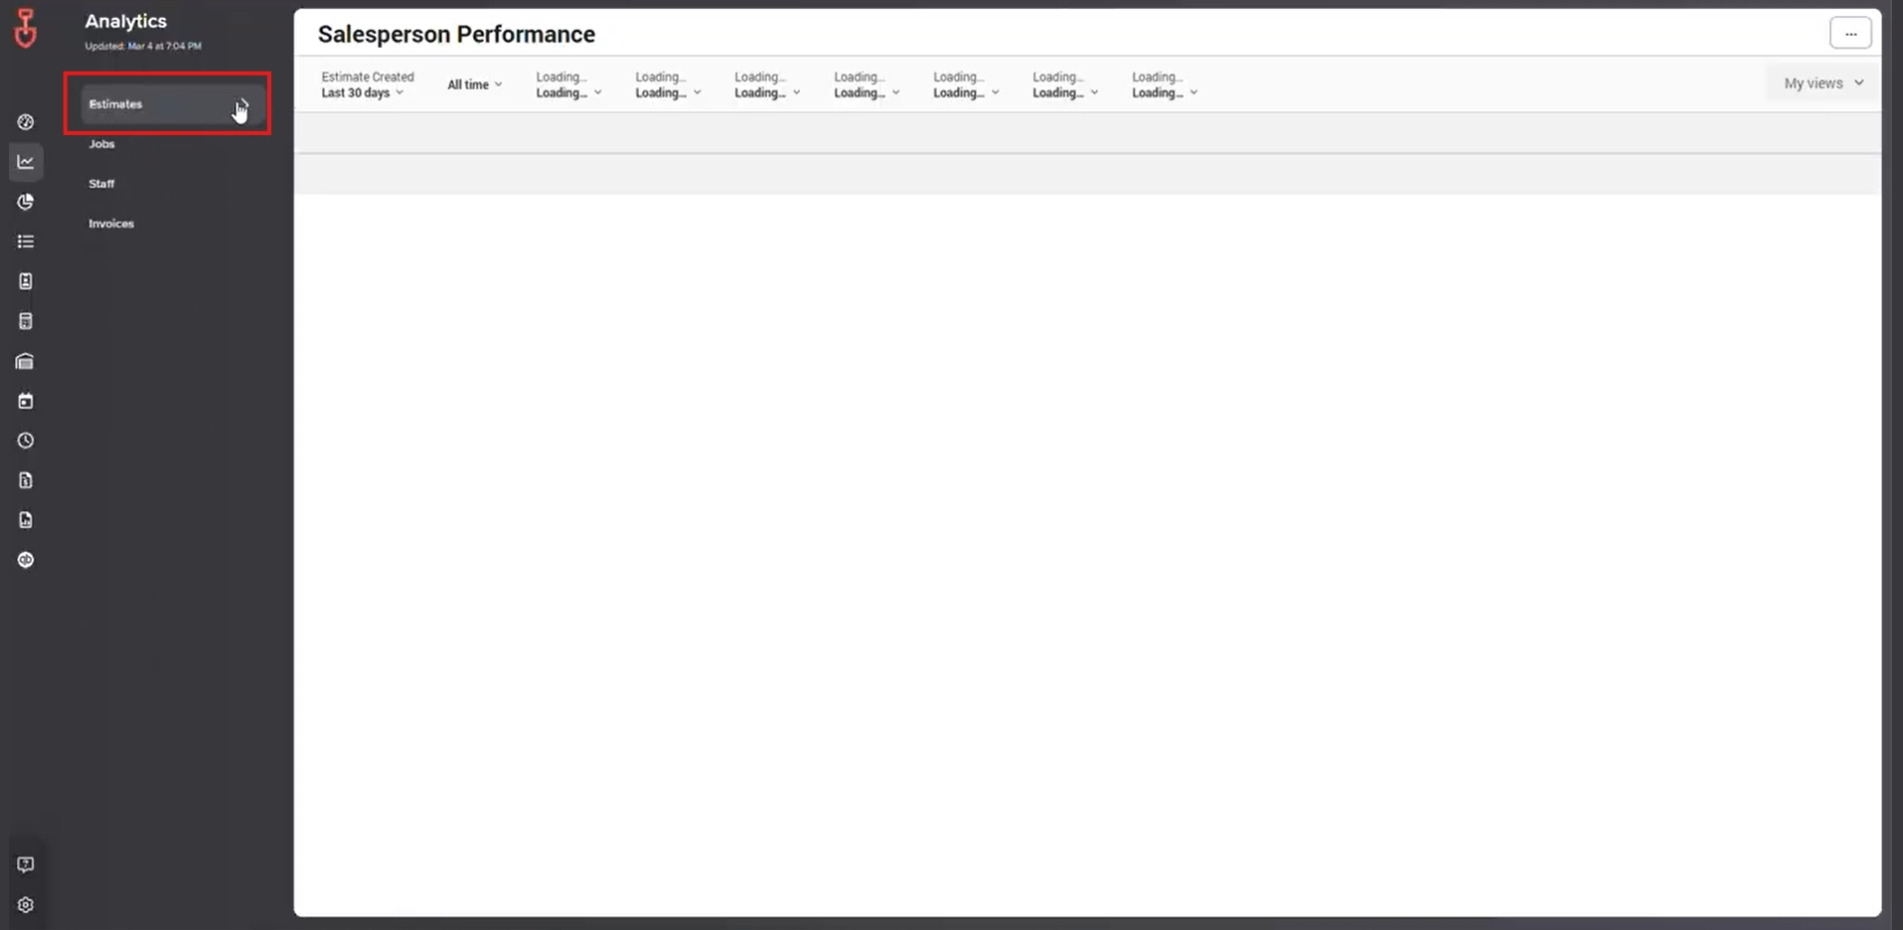
1. Estimates Dashboard: Salesperson Performance
The Estimates category includes the Salesperson Performance Dashboard, which provides detailed information about each salesperson’s activity.
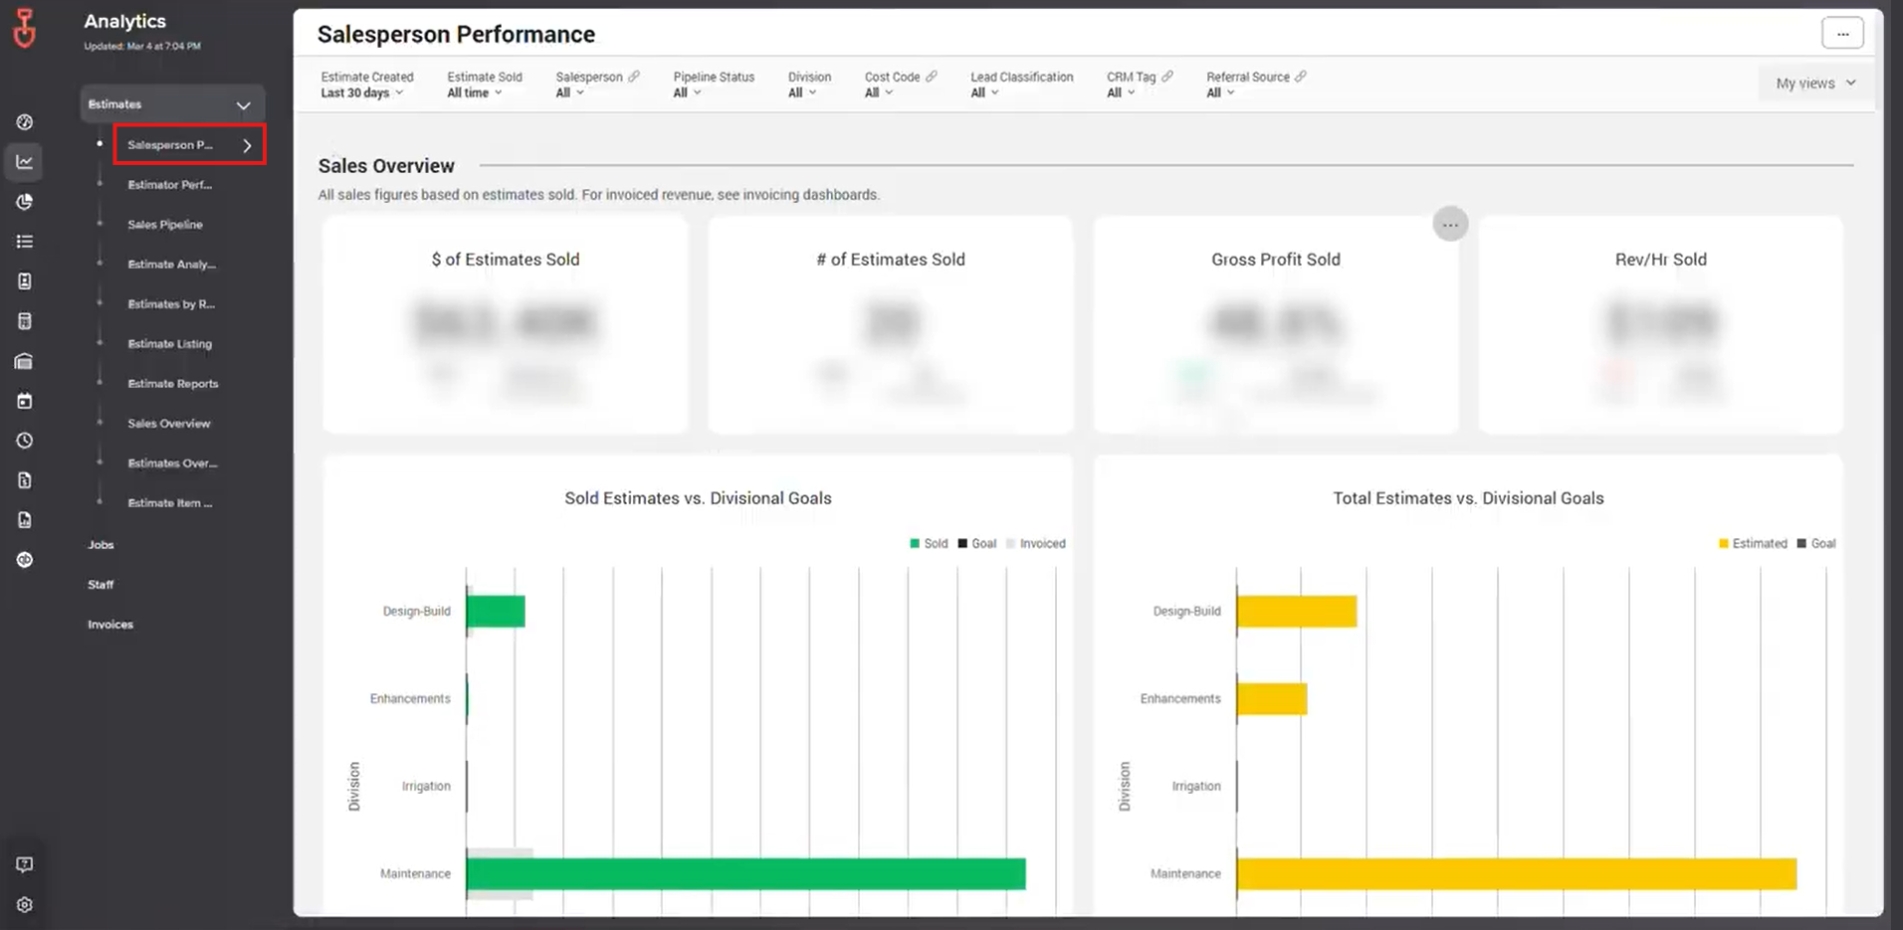
What You Can Track:
- Number of estimates created
- Conversion rates
- Overall performance compared to targets
This dashboard helps managers identify top performers, spot areas for coaching, and make data-driven decisions for sales strategies.
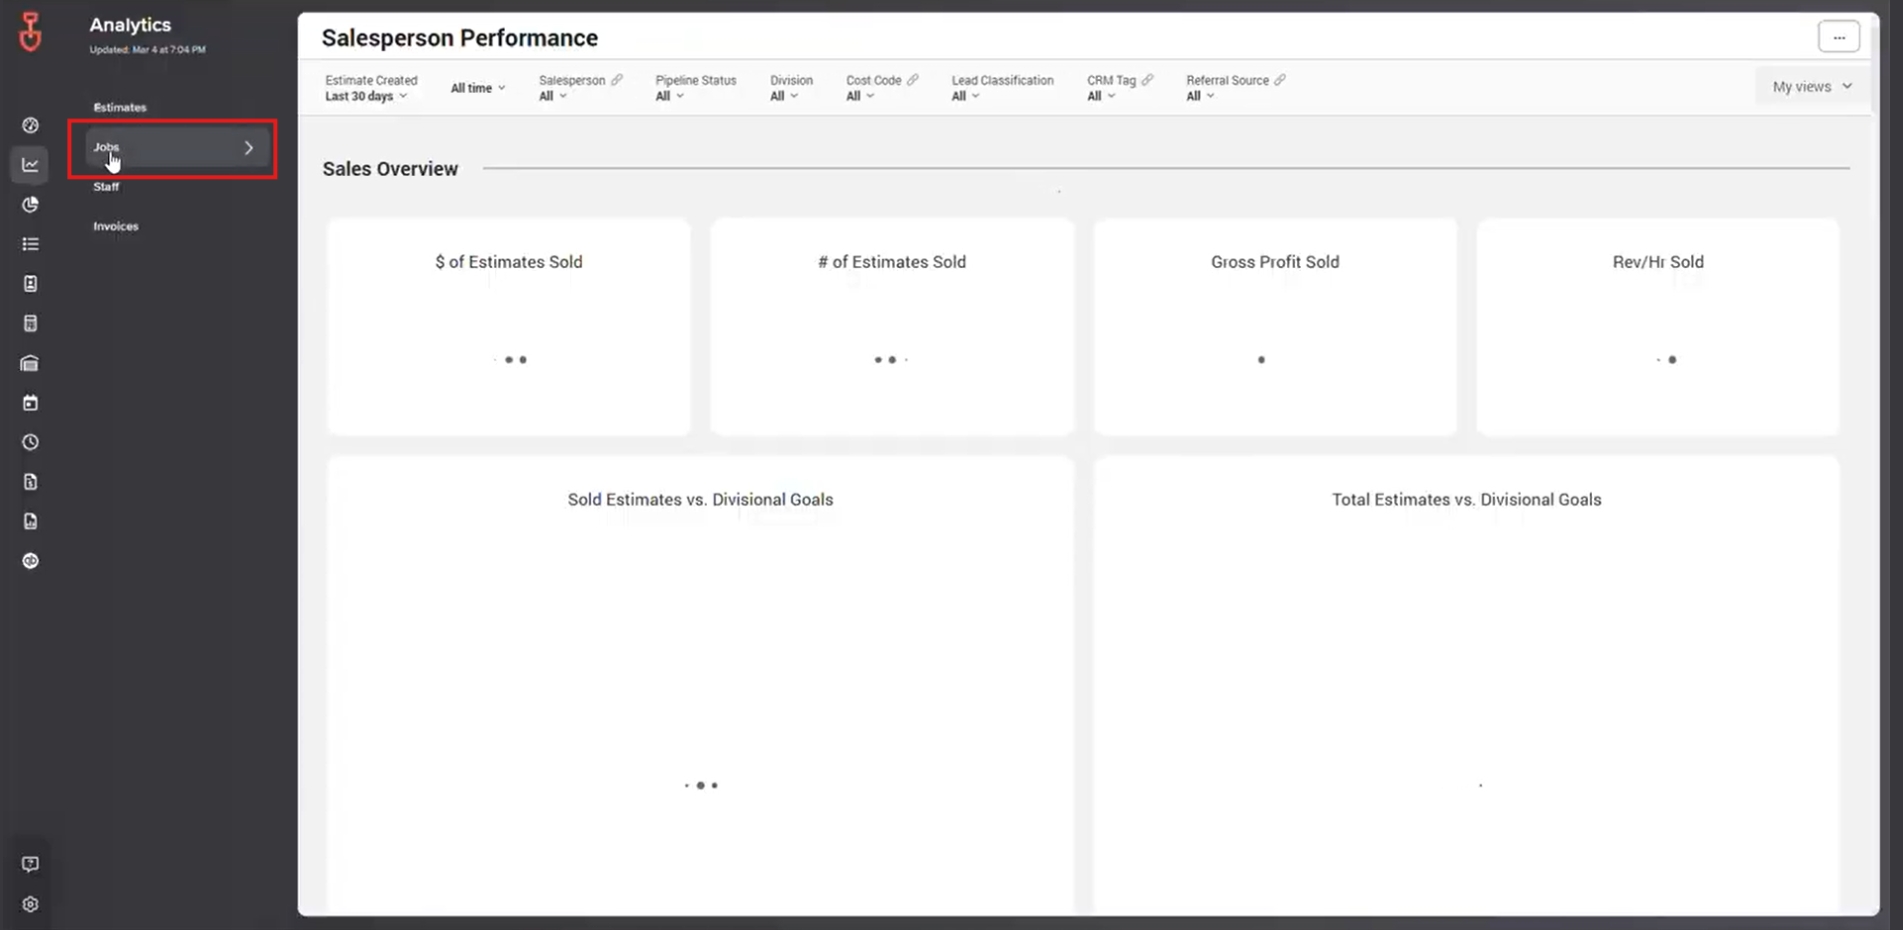
2. Jobs Dashboard: Job Cost Analysis
The Jobs Dashboard focuses on job performance and cost metrics, helping teams understand project efficiency and profitability.
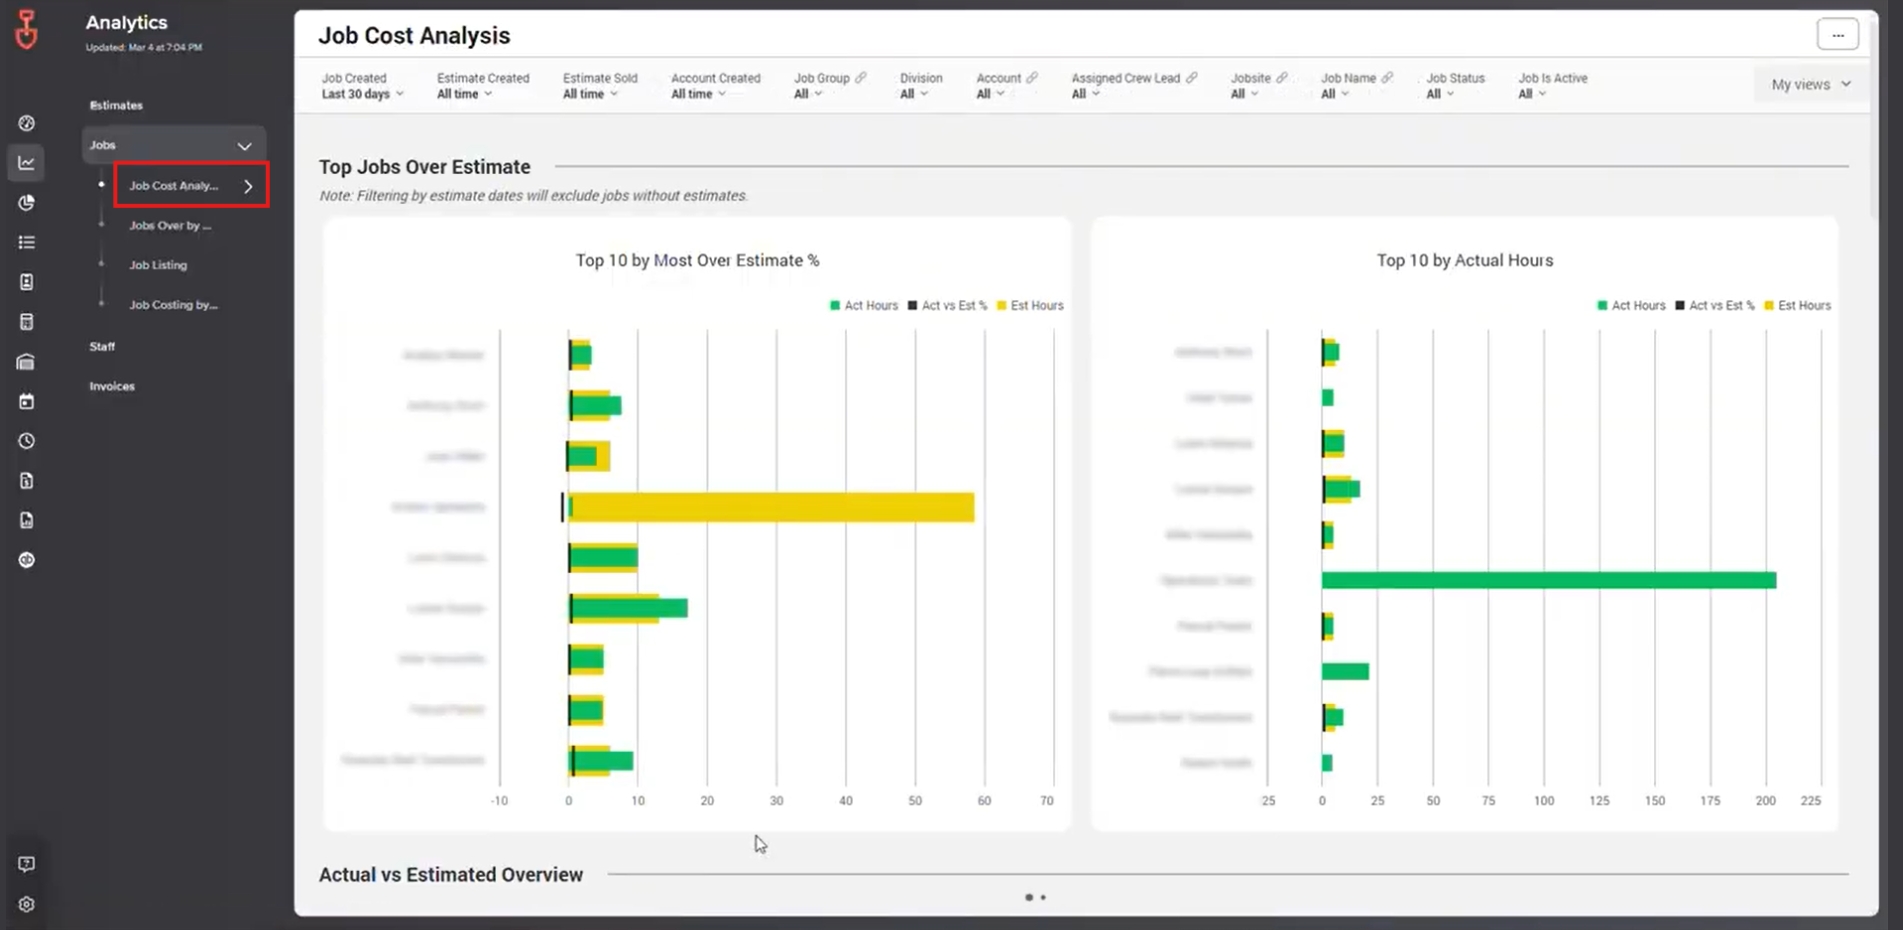
Key Insights Include:
- Top 10 by Most Over Estimate %
- Top 10 by Actual Hours
- Actual vs. Estimated Overview
Managers can use this data to identify over-budget jobs, monitor time usage, and adjust planning to improve margins.
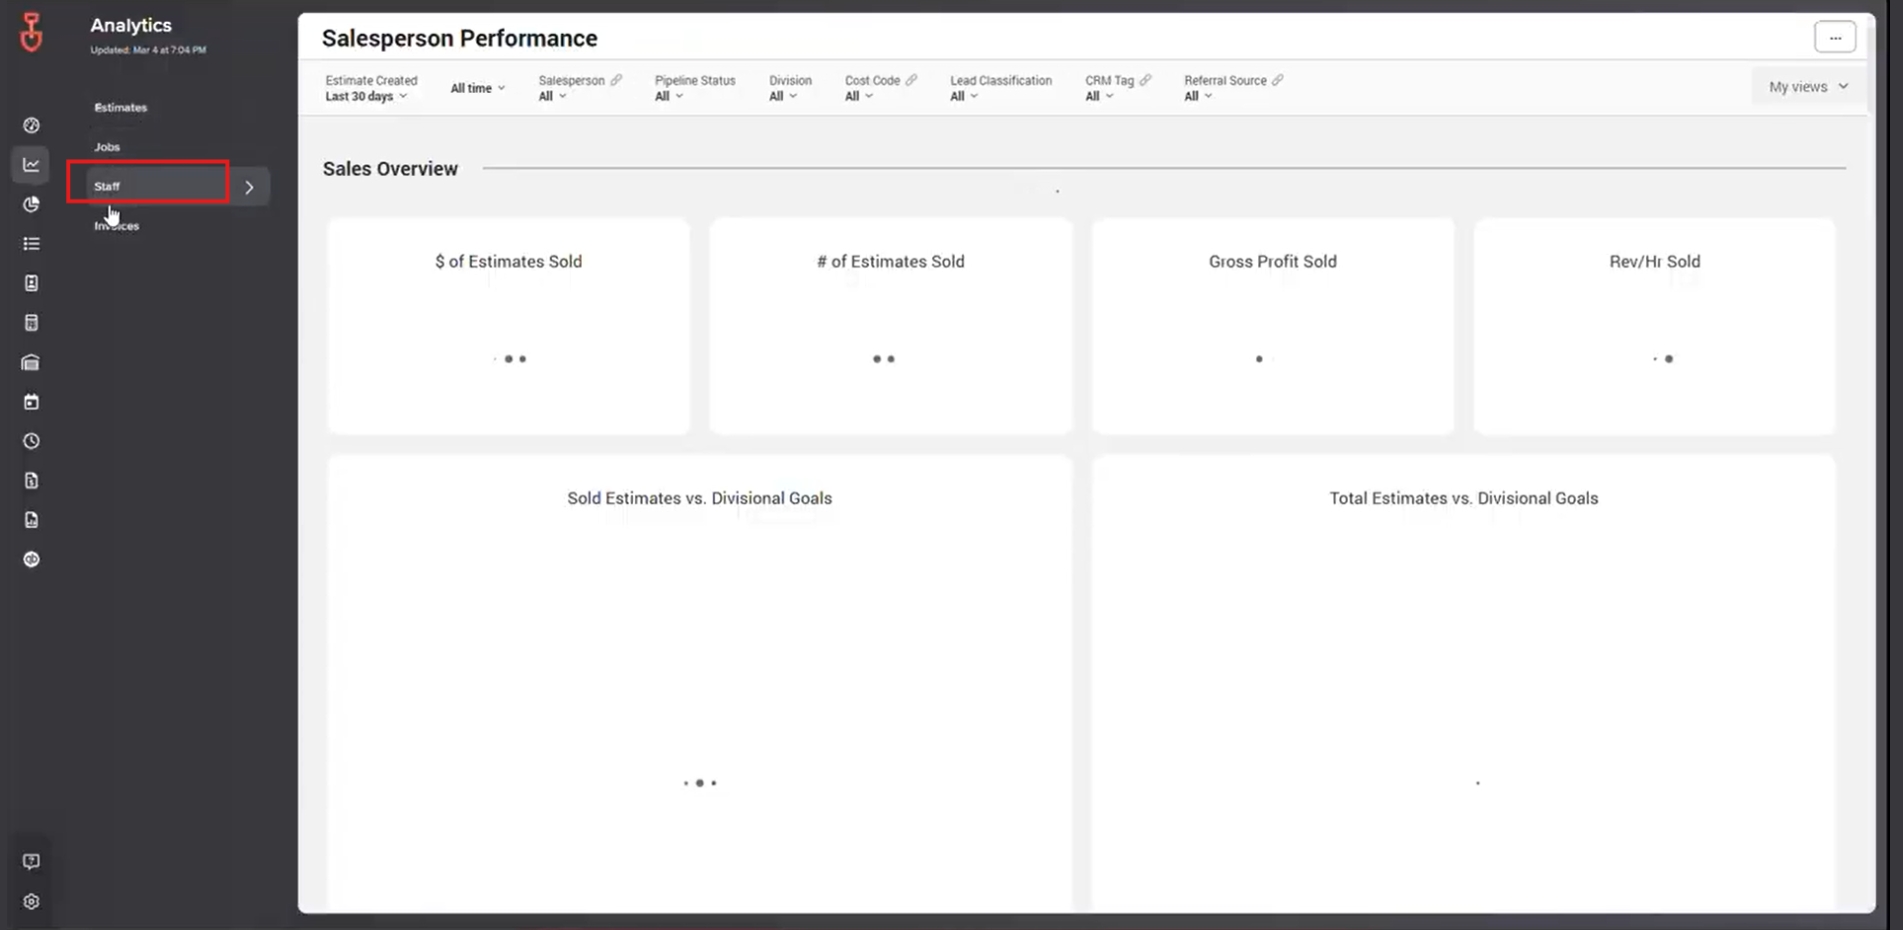
3. Staff Dashboard: Crew Performance
The Staff Dashboard provides visibility into crew performance and helps track workforce productivity.
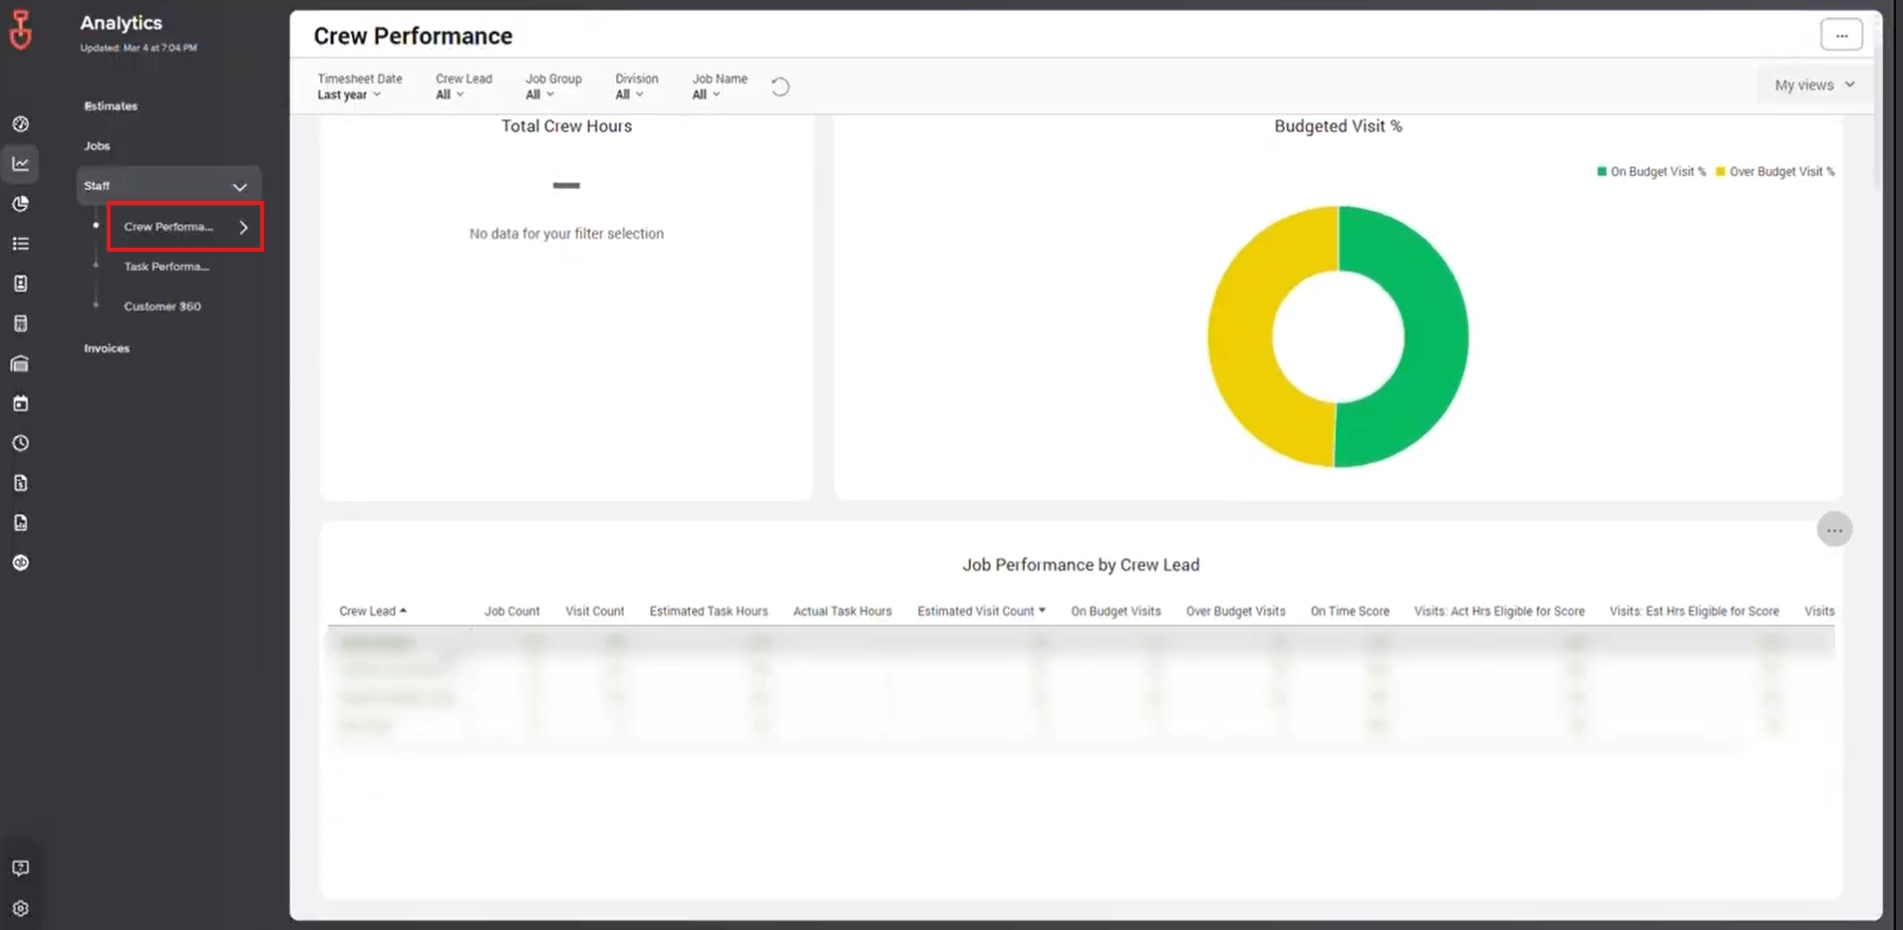
Metrics You Can Review:
- Total crew hours
- Budgeted visit %
- Crew lead performance
- Additional staff-related insights
Using this dashboard helps ensure crews are performing efficiently, and it highlights opportunities for training or schedule optimization.
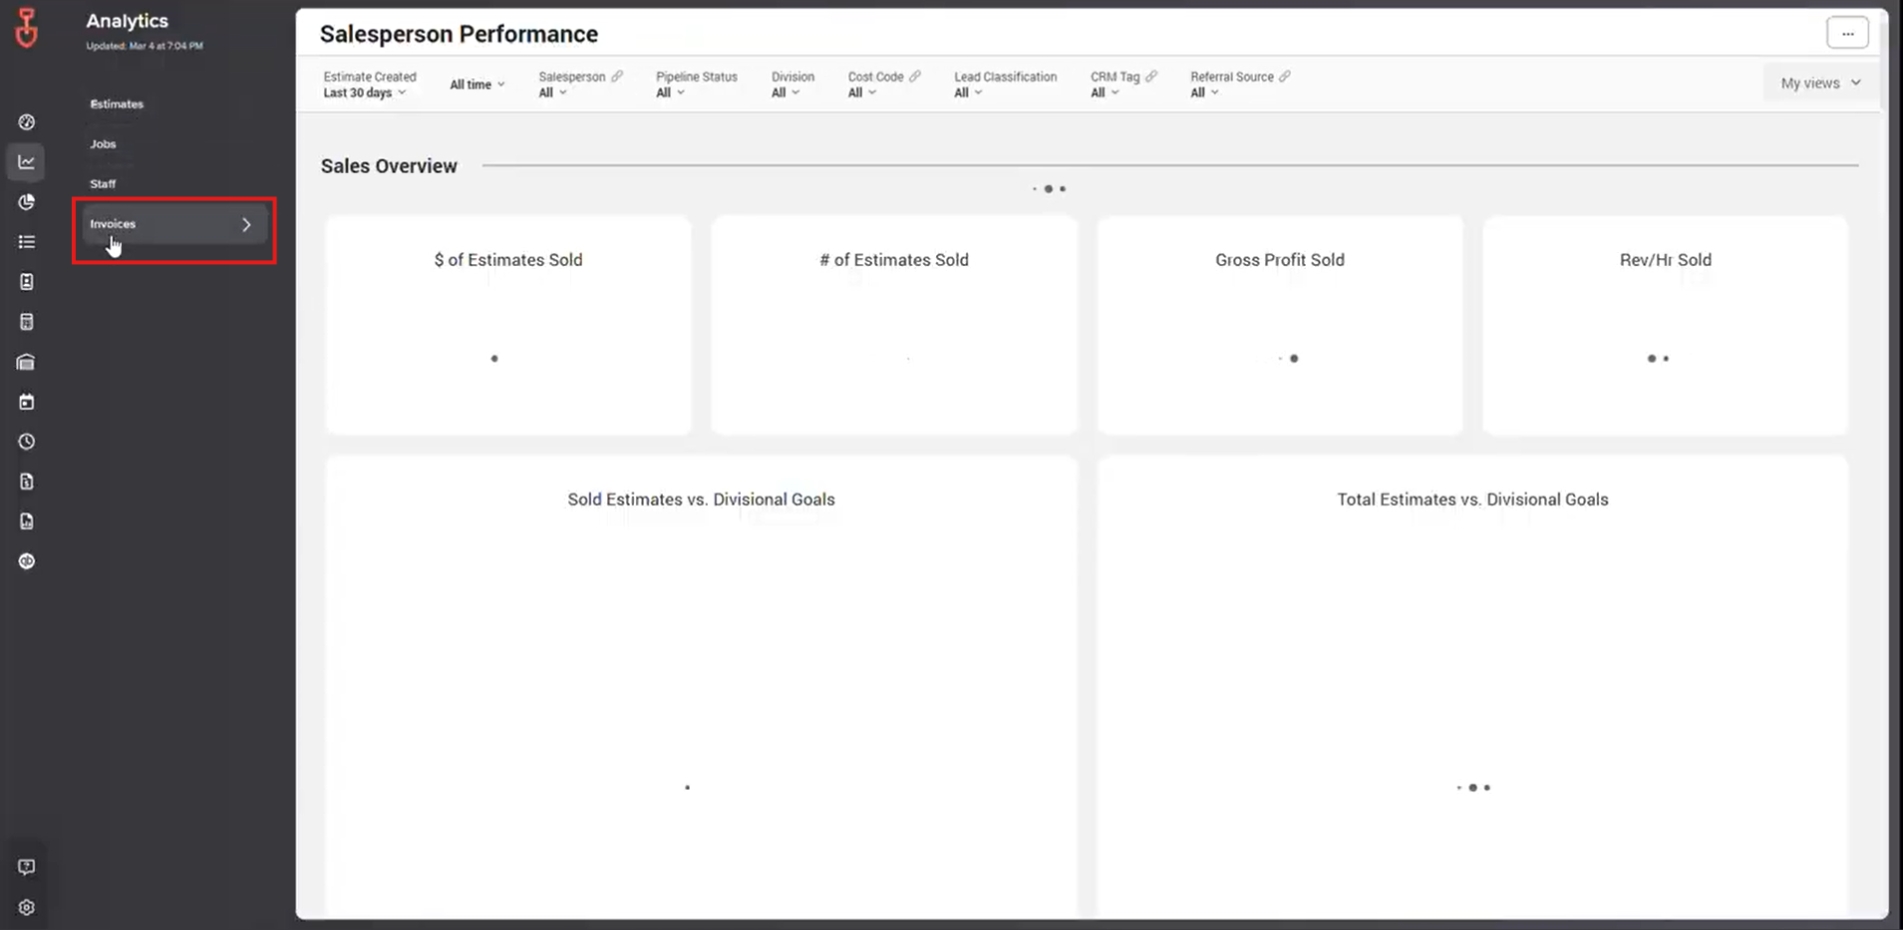
4. Invoices Dashboard: Financial Overview
The Invoices Dashboard shows all invoice-related information, giving a clear view of outstanding balances and overall revenue.
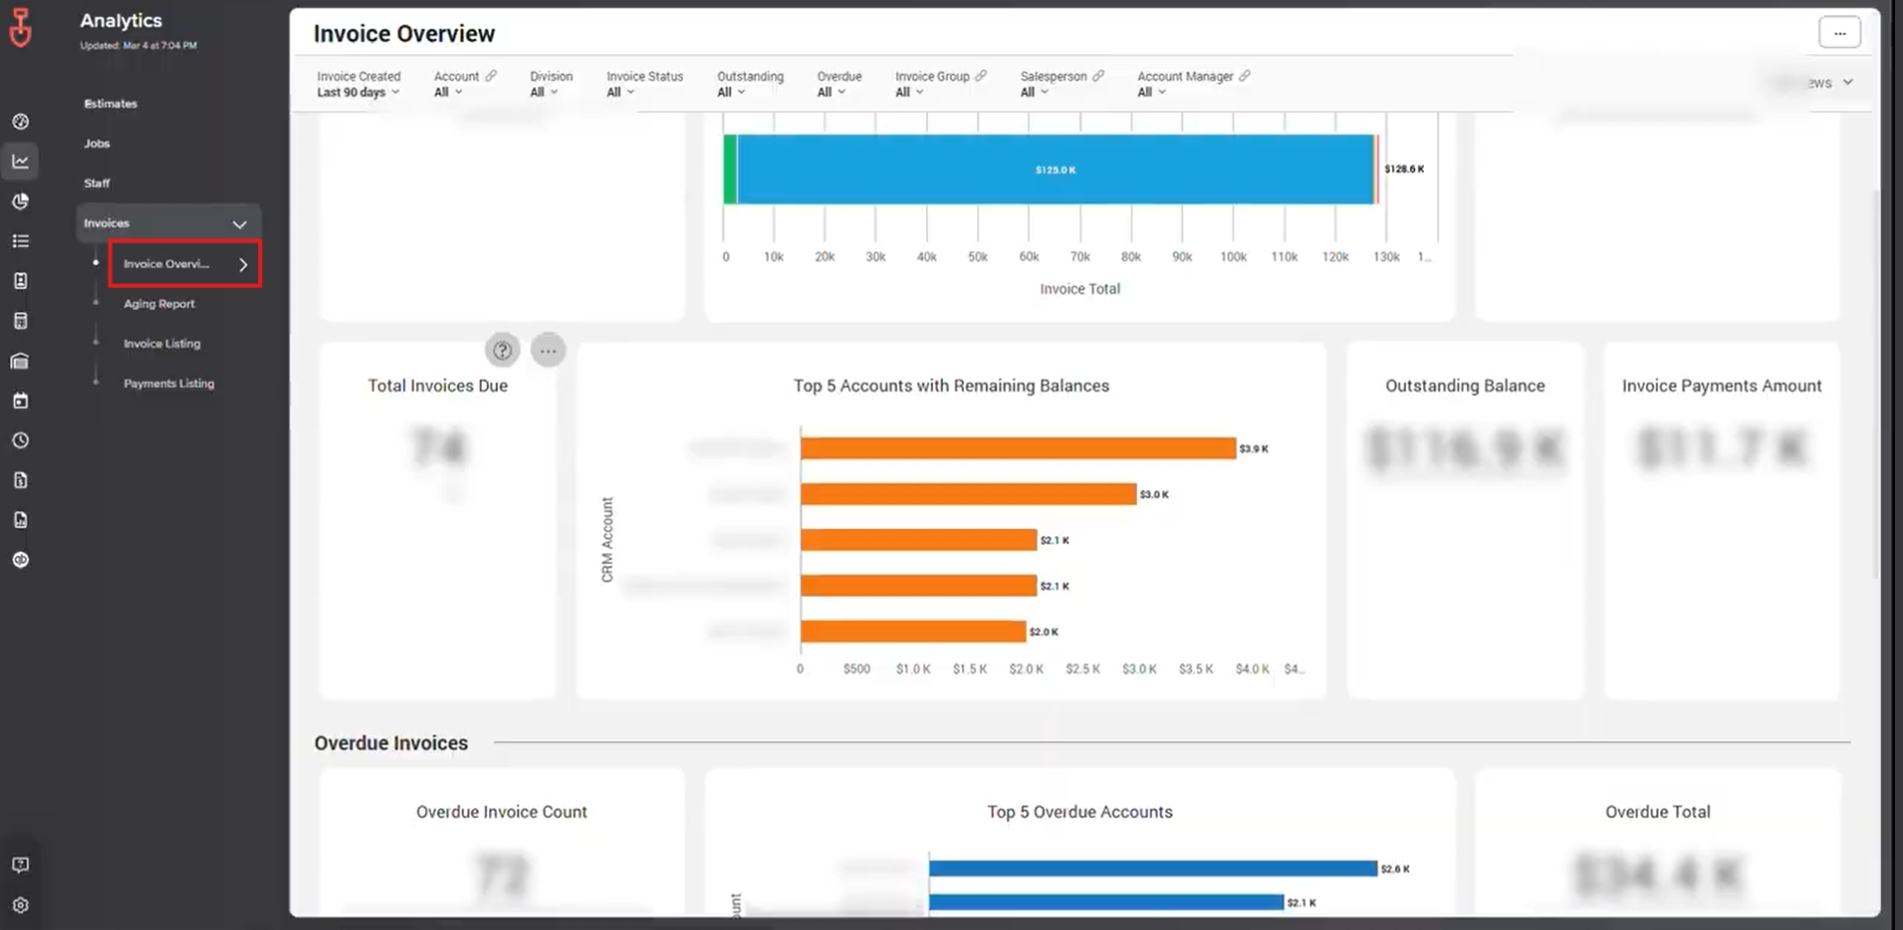
Metrics You Can Track:
- Total number of invoices and status
- Total invoice amounts
- Outstanding balances
This helps accounting teams quickly see overdue invoices, track cash flow, and ensure financial processes stay on track.
Best Practices for Using LMN Analytics
To get the most from LMN dashboards:
- Regularly review all four dashboards to identify trends
- Use the data to guide operational and financial decisions
- Compare estimates and job data to find areas for improvement
- Monitor staff dashboards to optimize scheduling and efficiency
Why This Matters
When dashboards are used consistently:
- Sales performance is easier to track
- Job costs and productivity are transparent
- Staff management becomes data-driven
- Financial visibility improves, reducing overdue invoices
LMN Analytics dashboards provide actionable insights that help keep your business running smoothly. Understanding each dashboard and using it regularly ensures the team is informed, efficient, and aligned.
Download a PDF version of the job aide here