
This job aid is designed to guide team members through the standardized process of creating a new contact in LMN CRM. By following these steps, users can ensure all customer and site information is accurately recorded, facilitating efficient scheduling, quoting, and service delivery.
Steps to Create Contact & Property in LMN
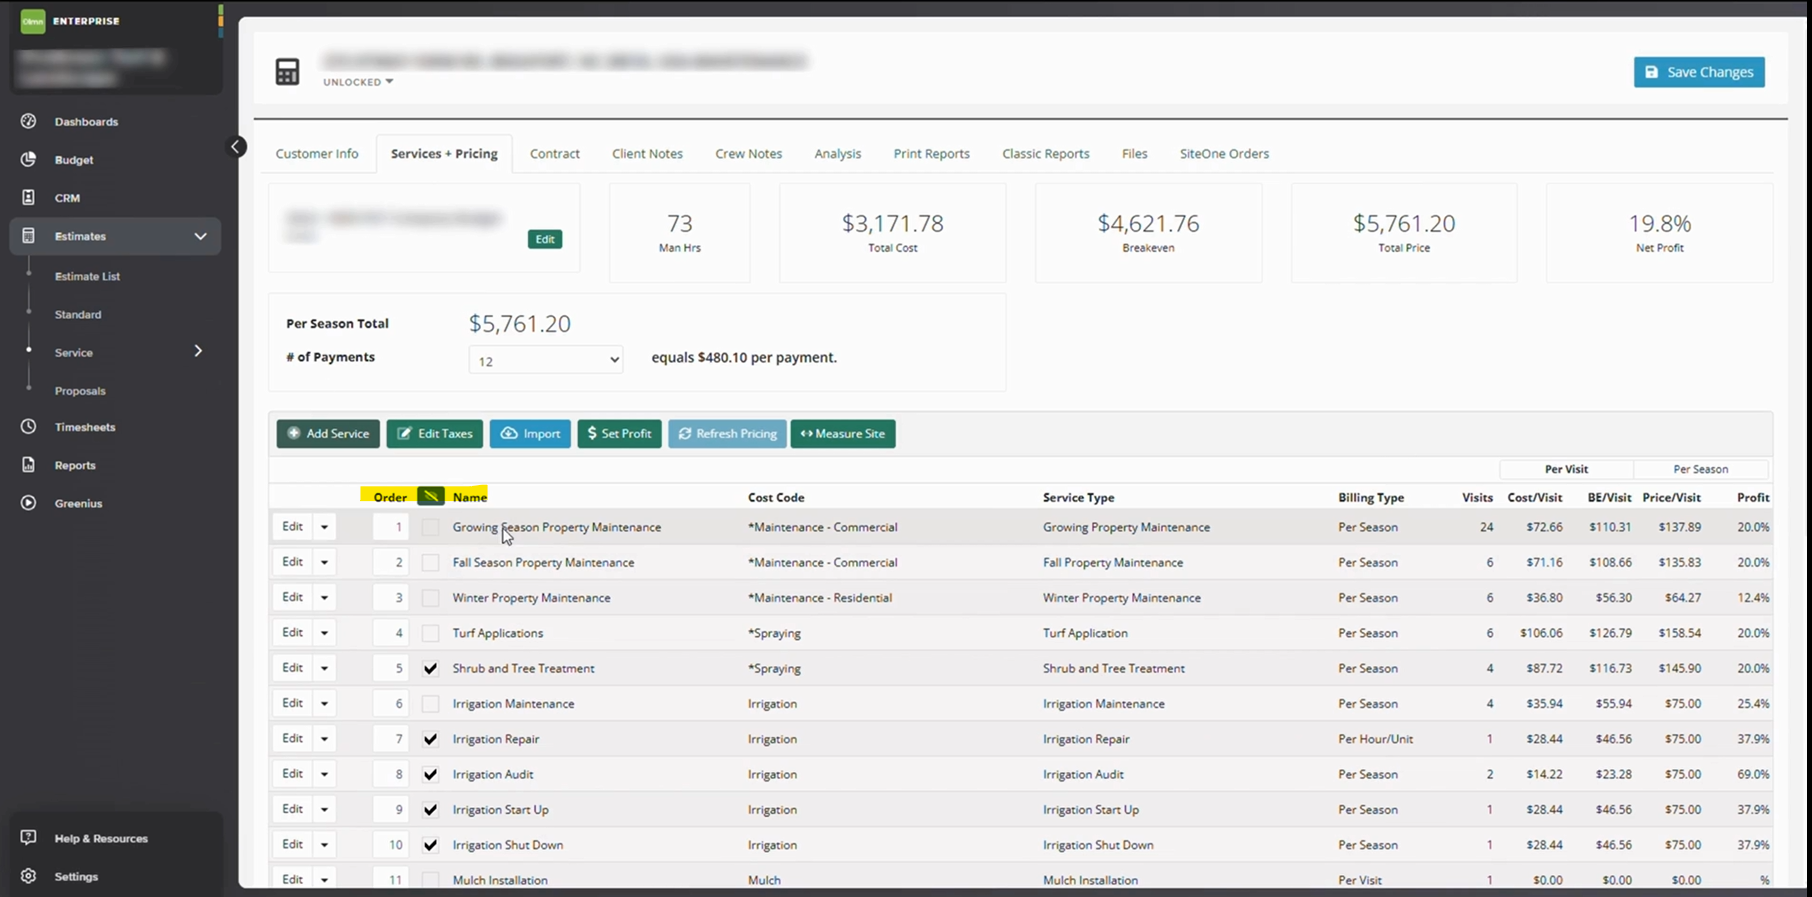
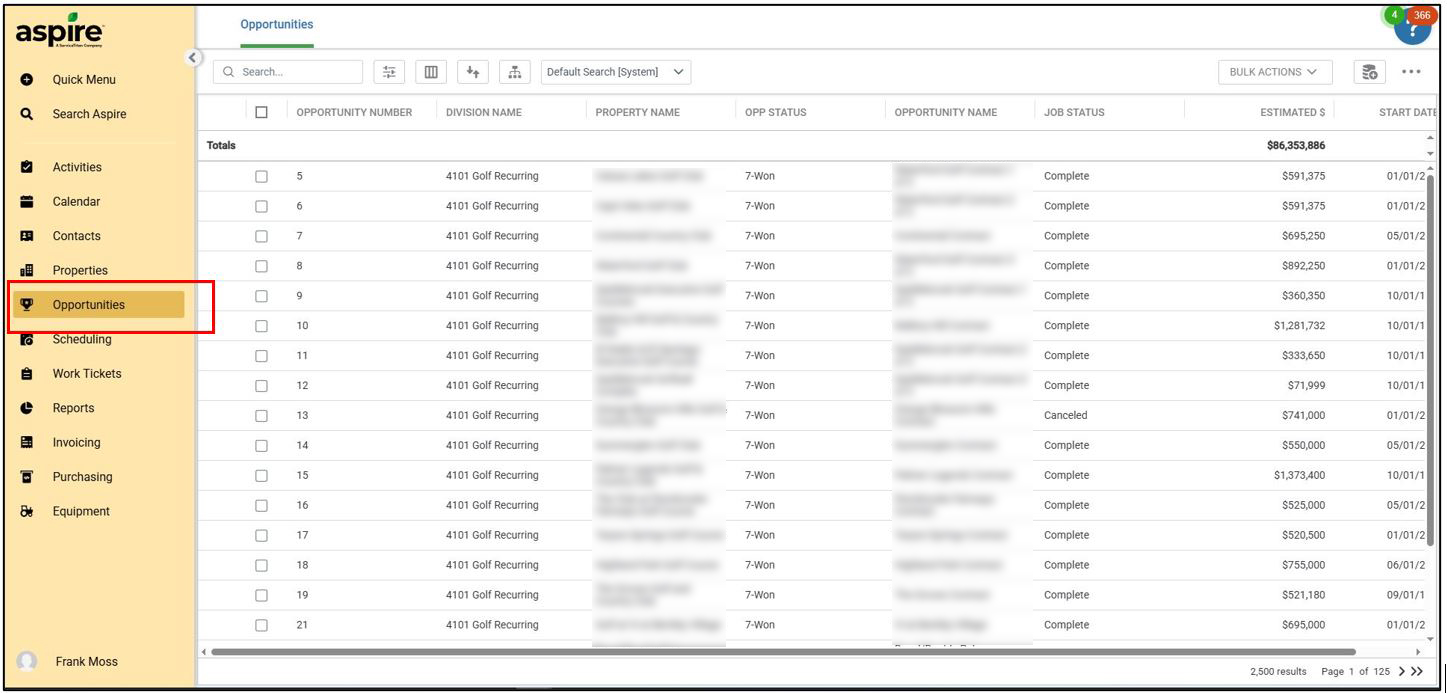
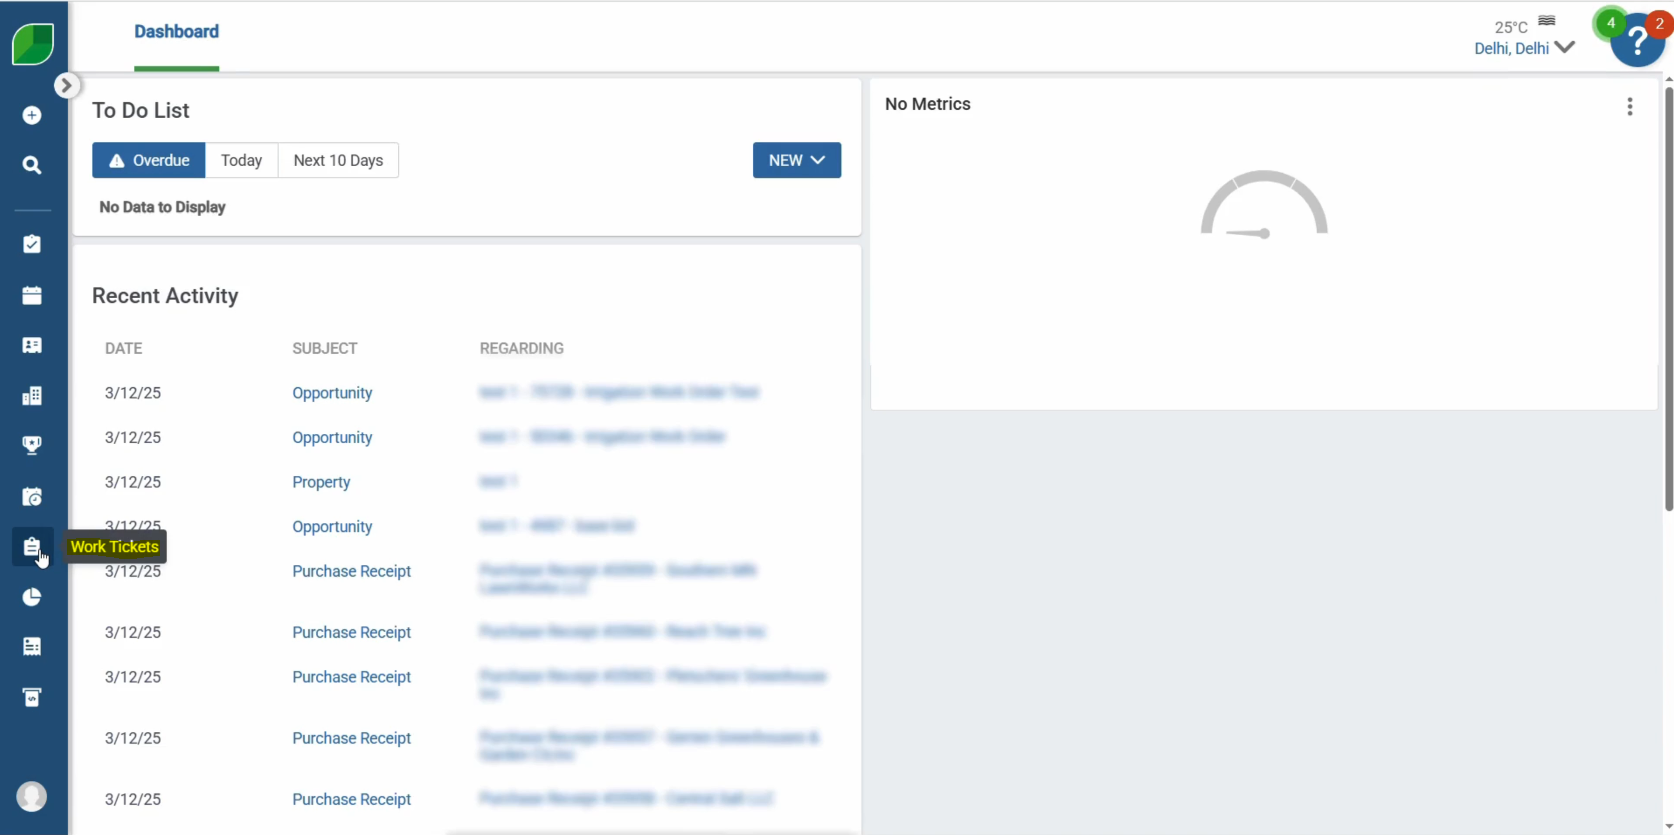
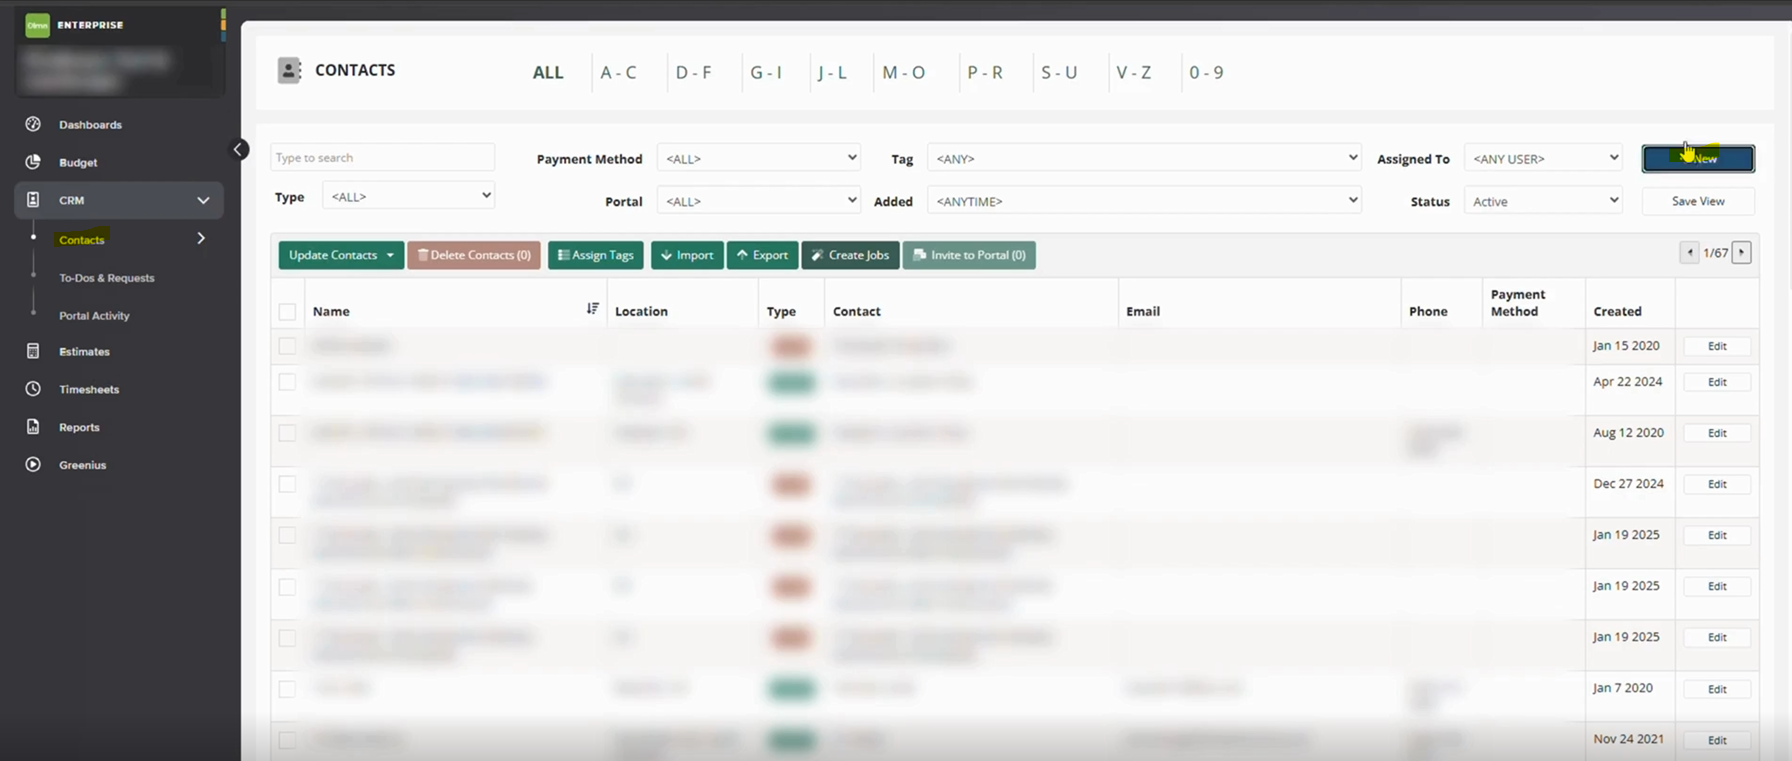
Step 1: Access LMN CRM
- Log into your LMN account.
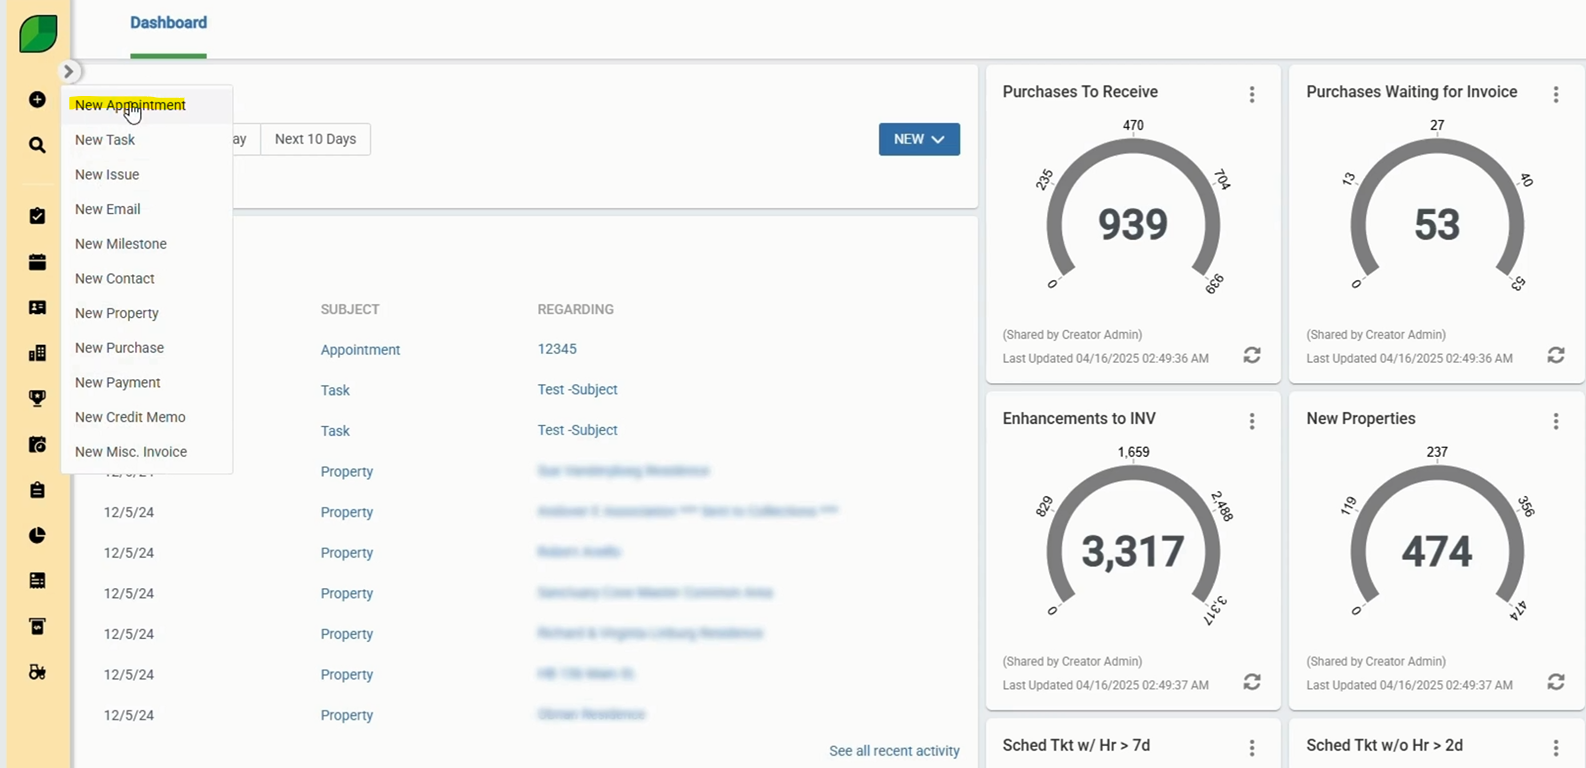
- Navigate to the CRM tab from the main dashboard.
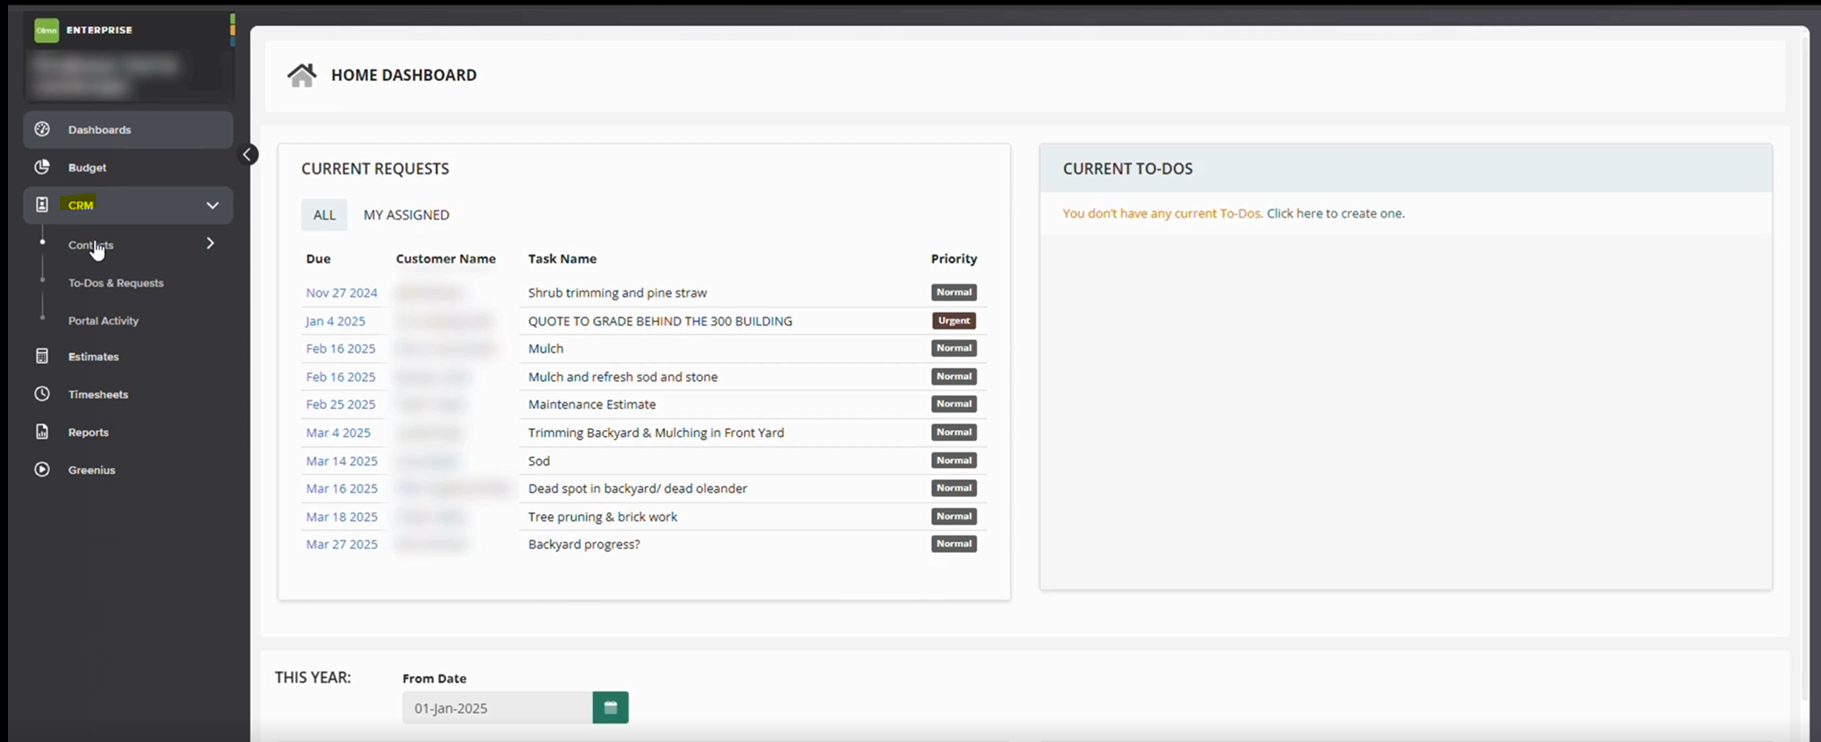
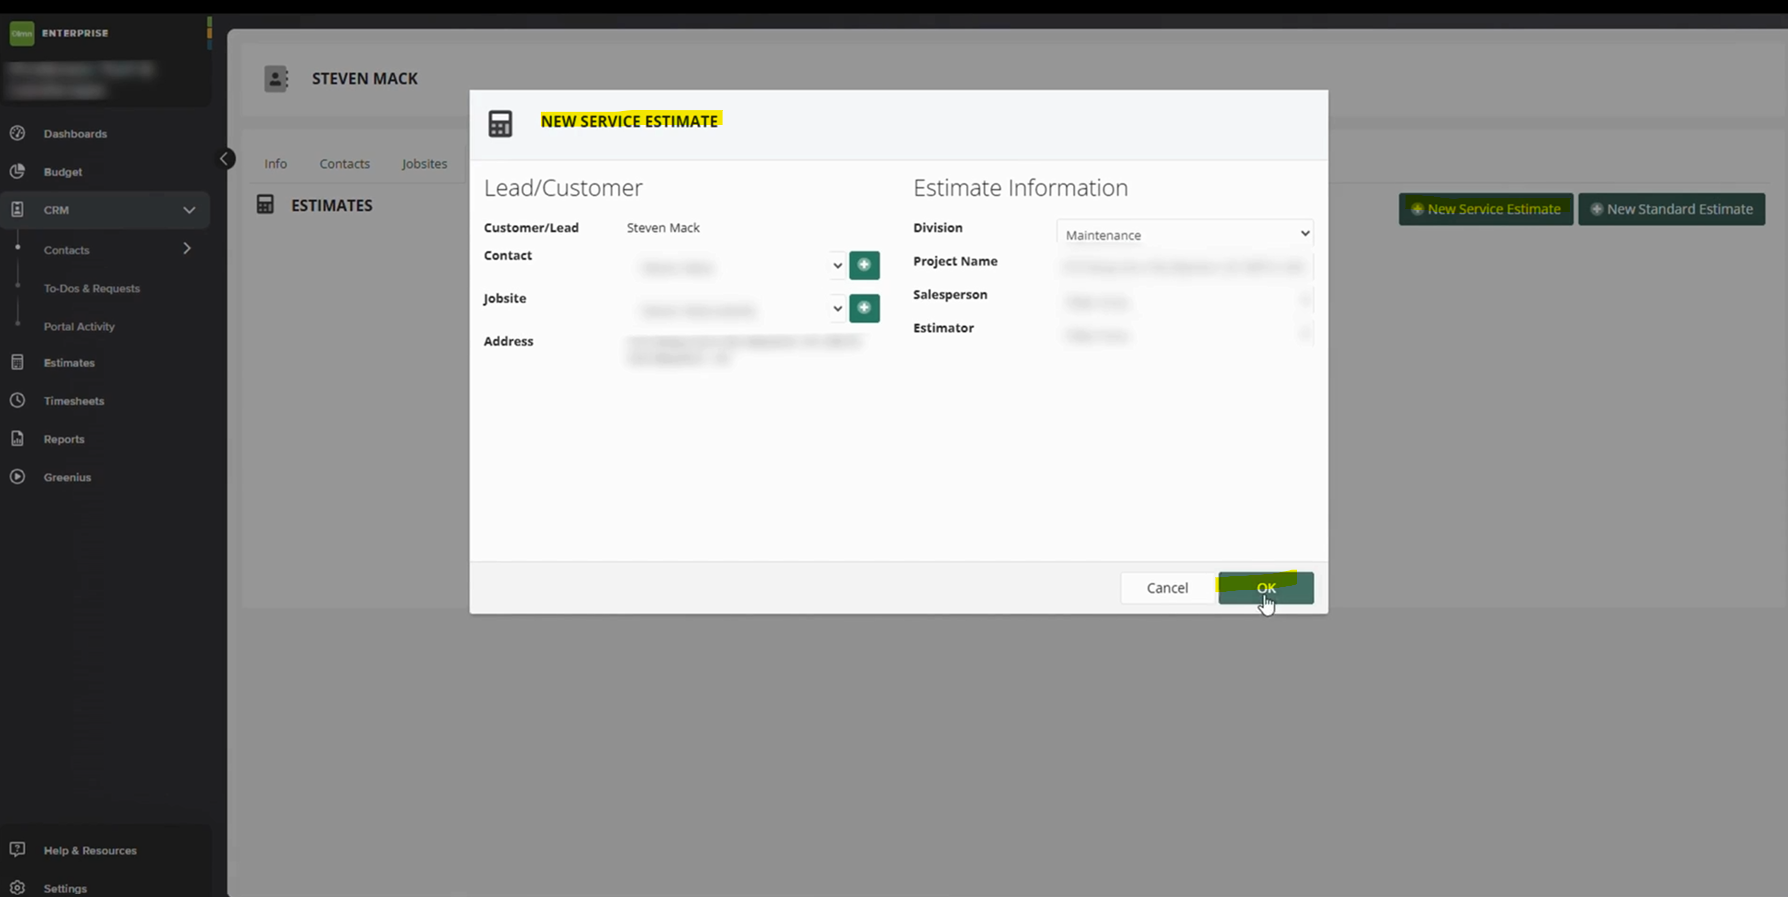
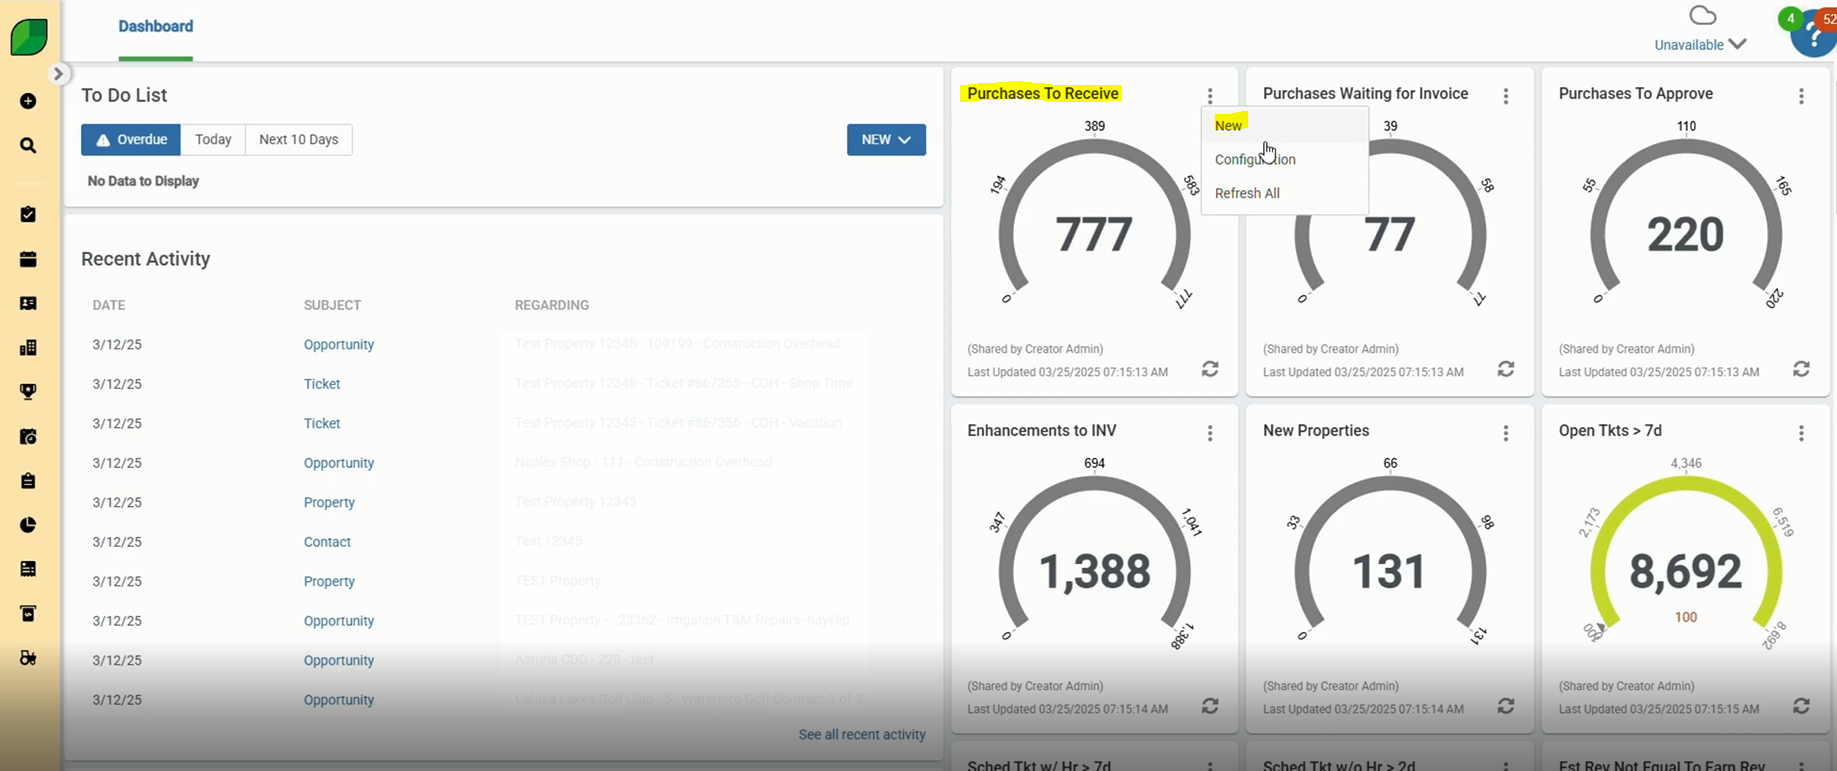
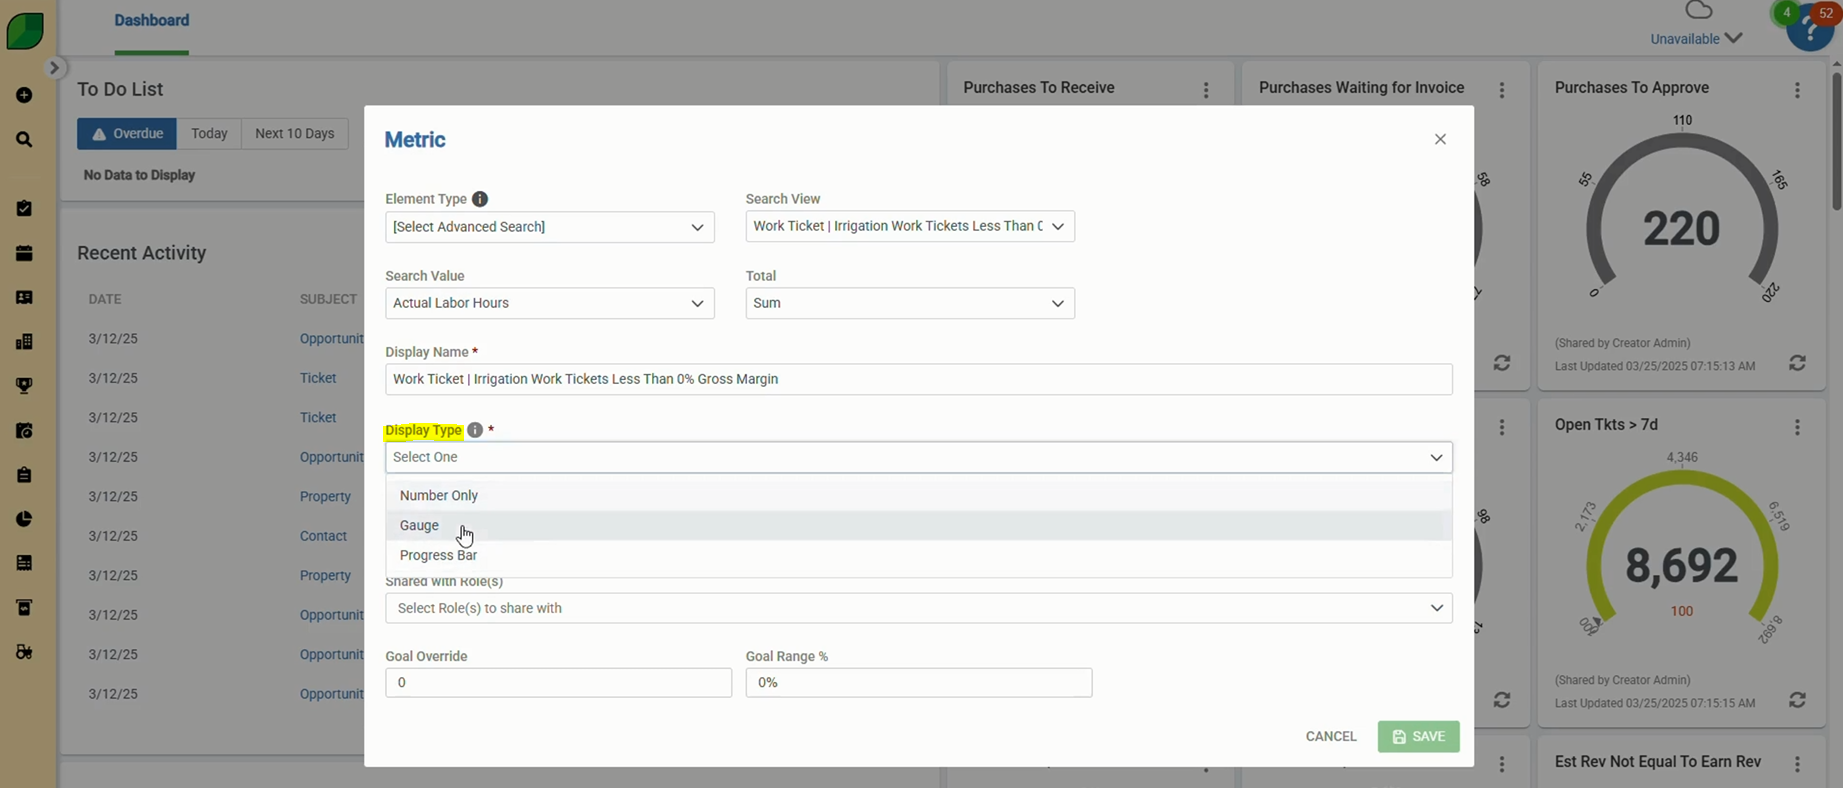
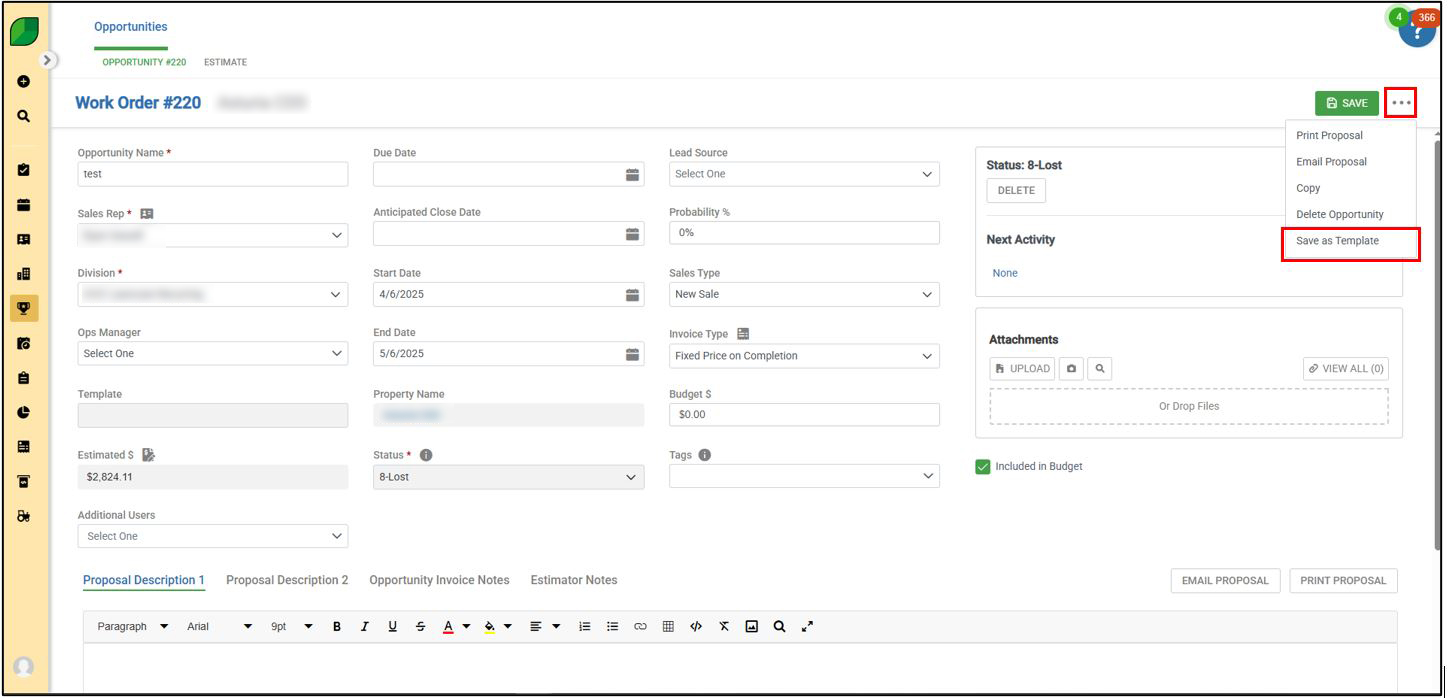
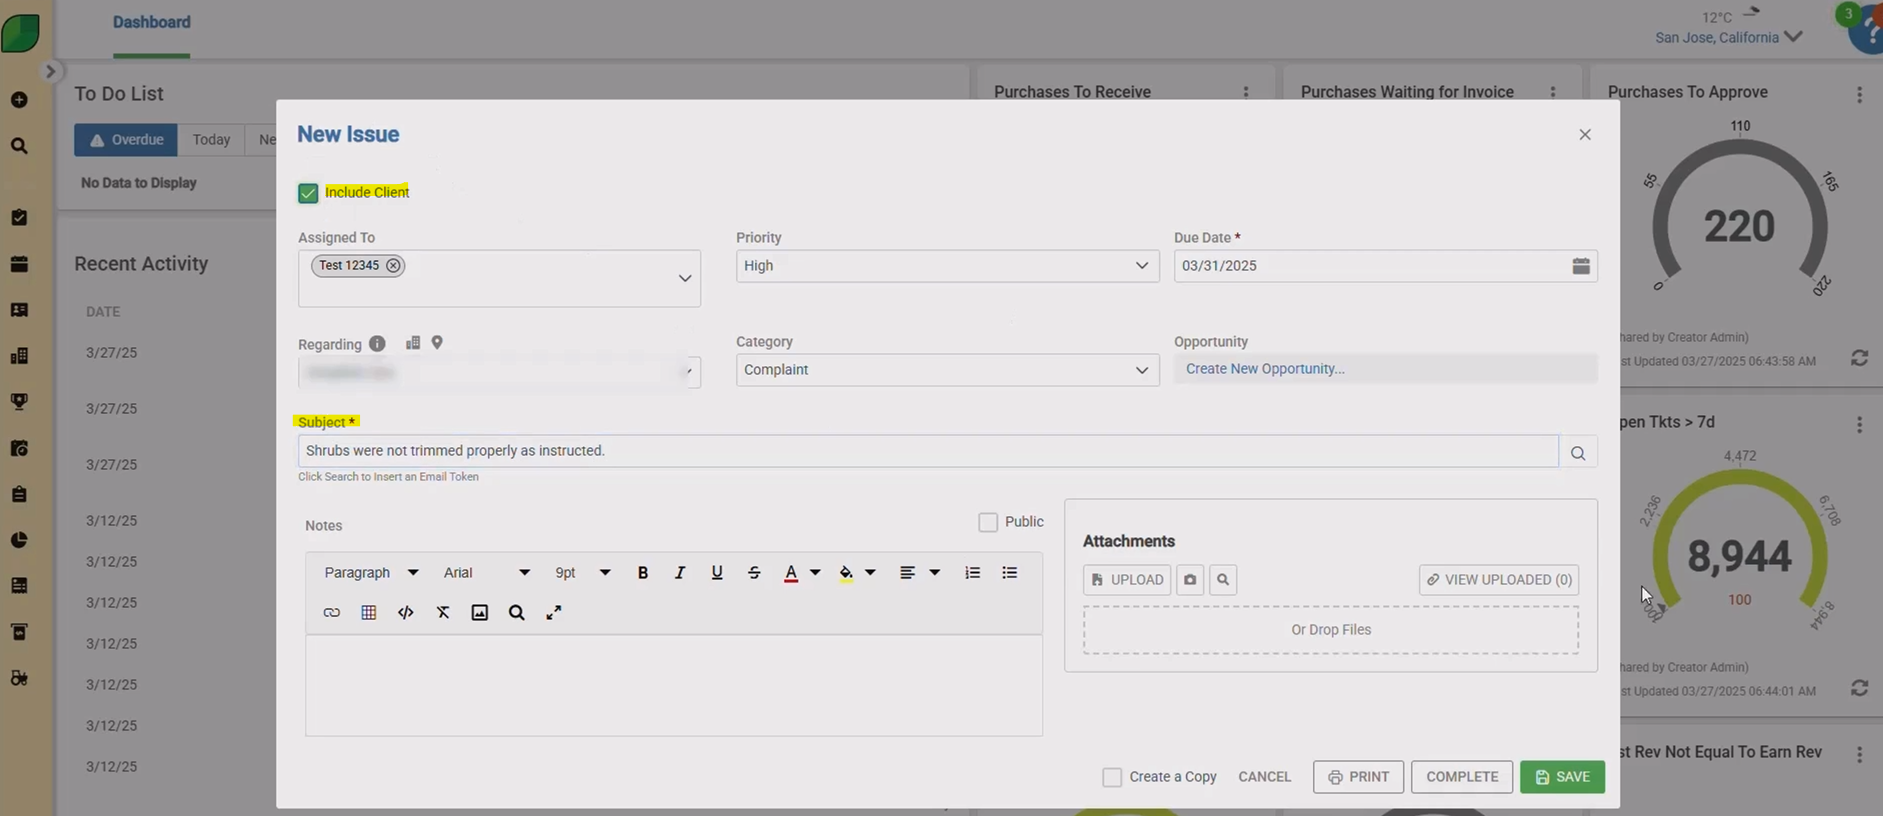
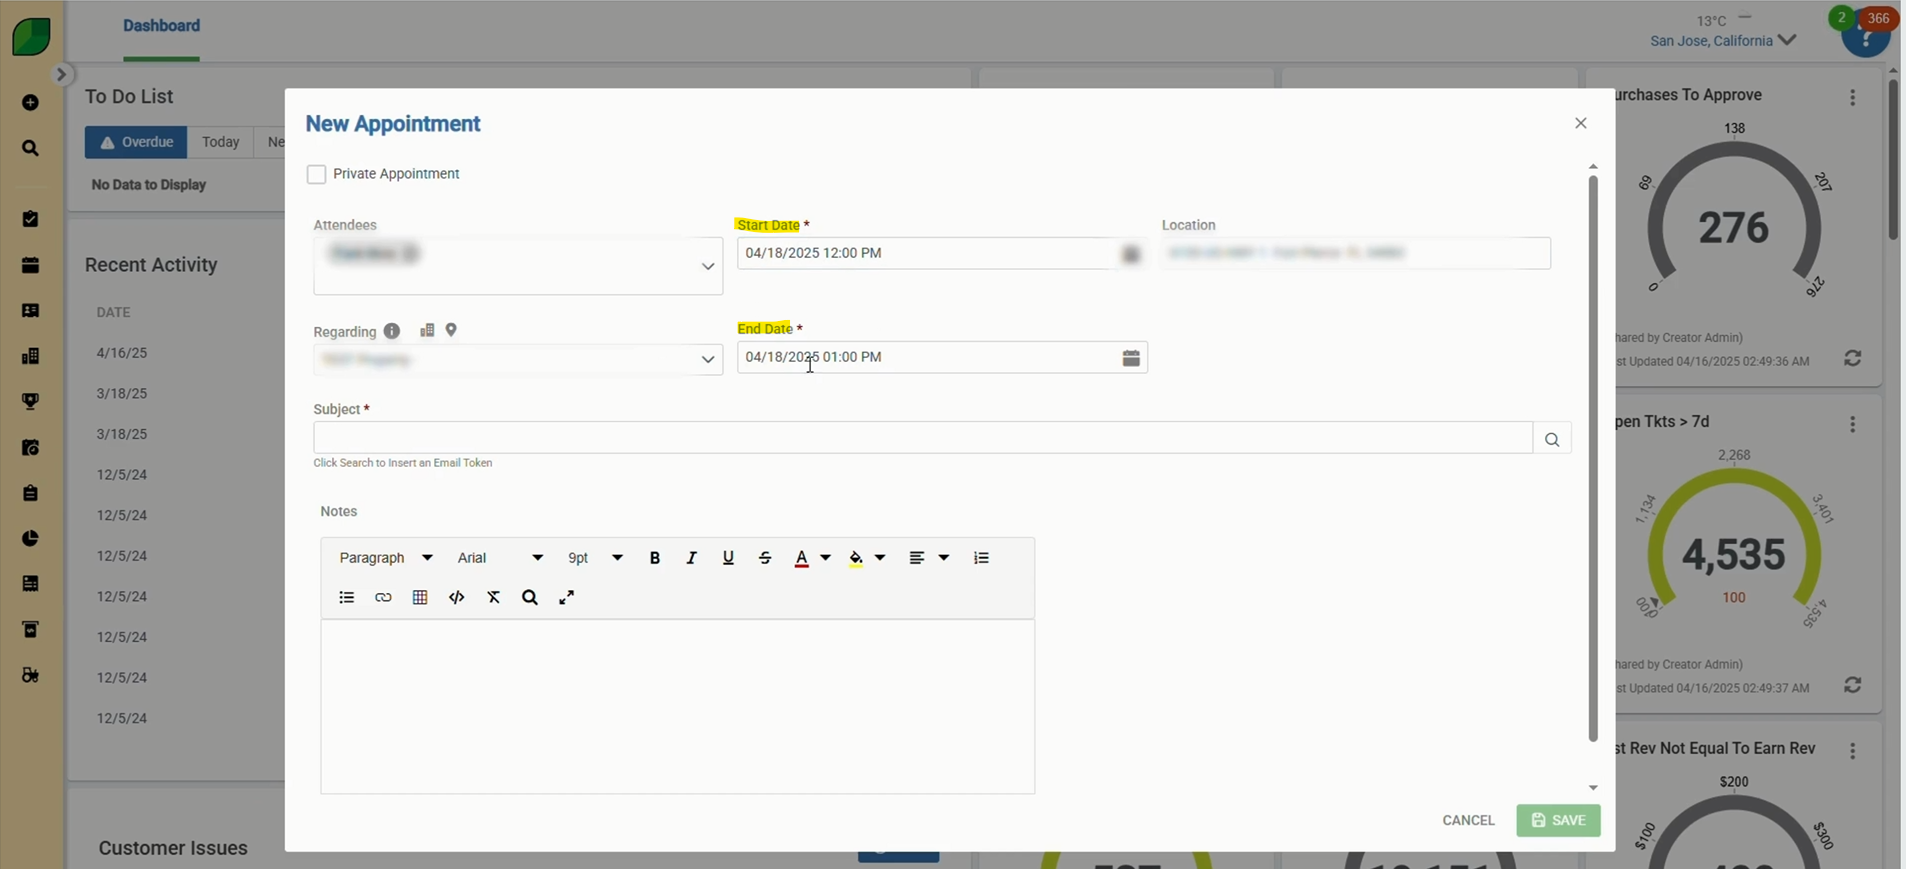
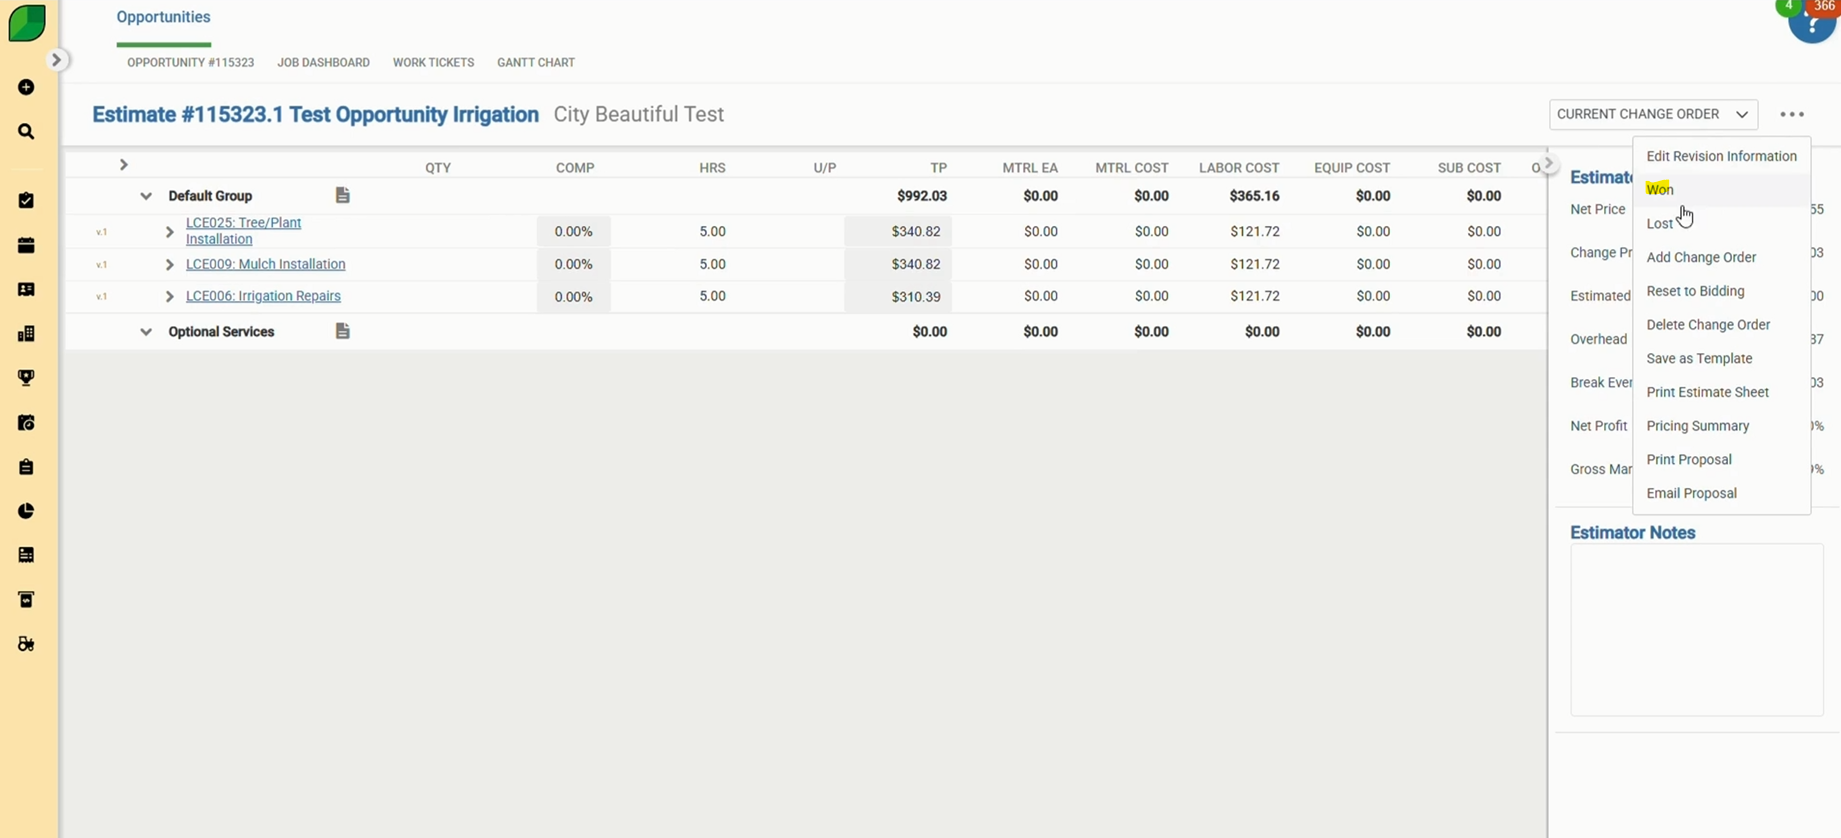
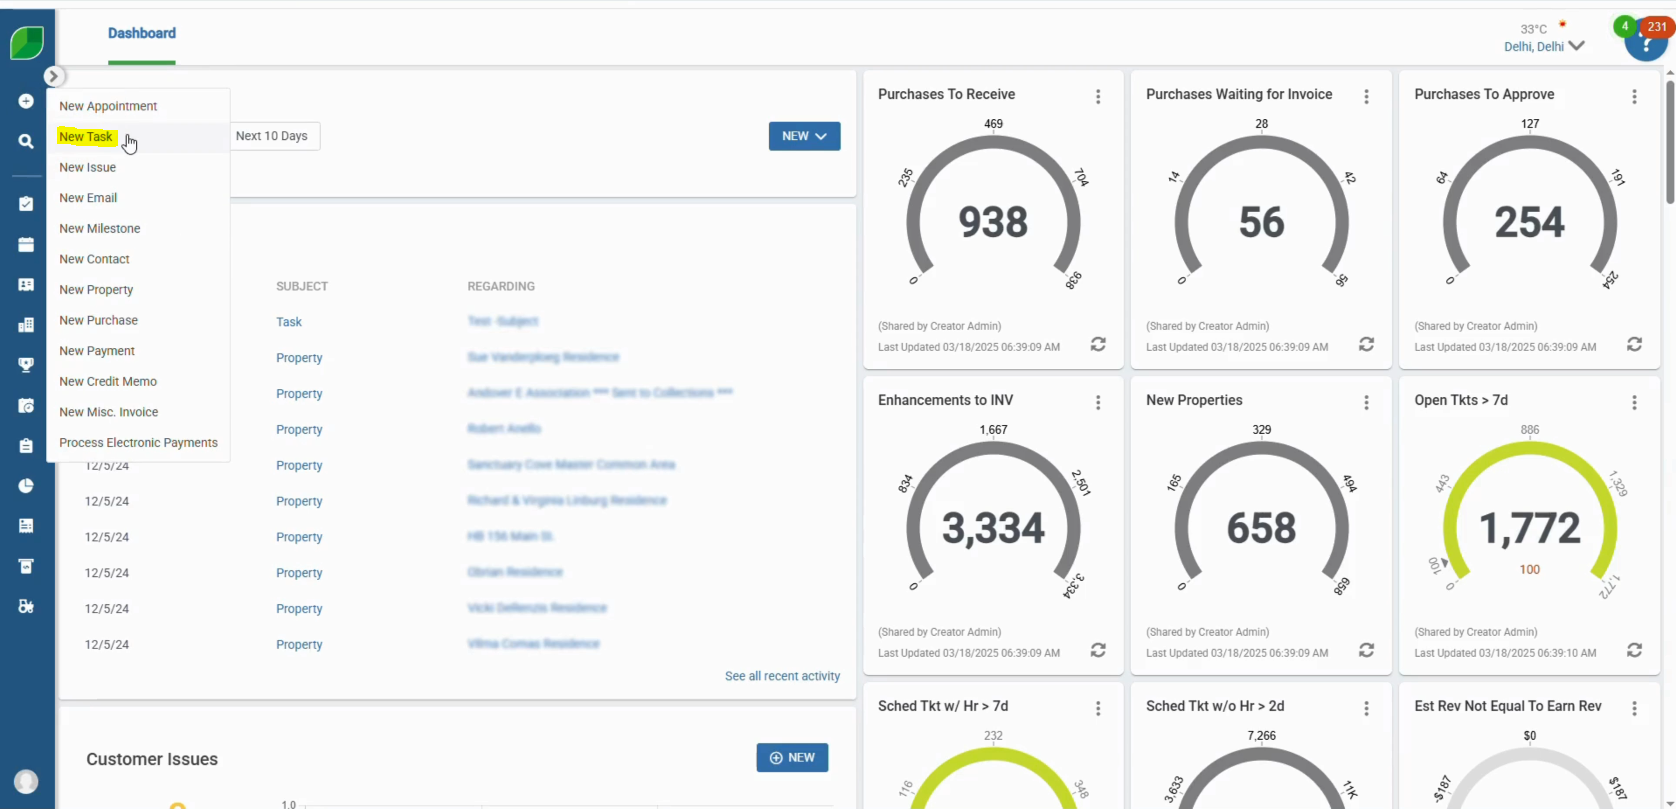
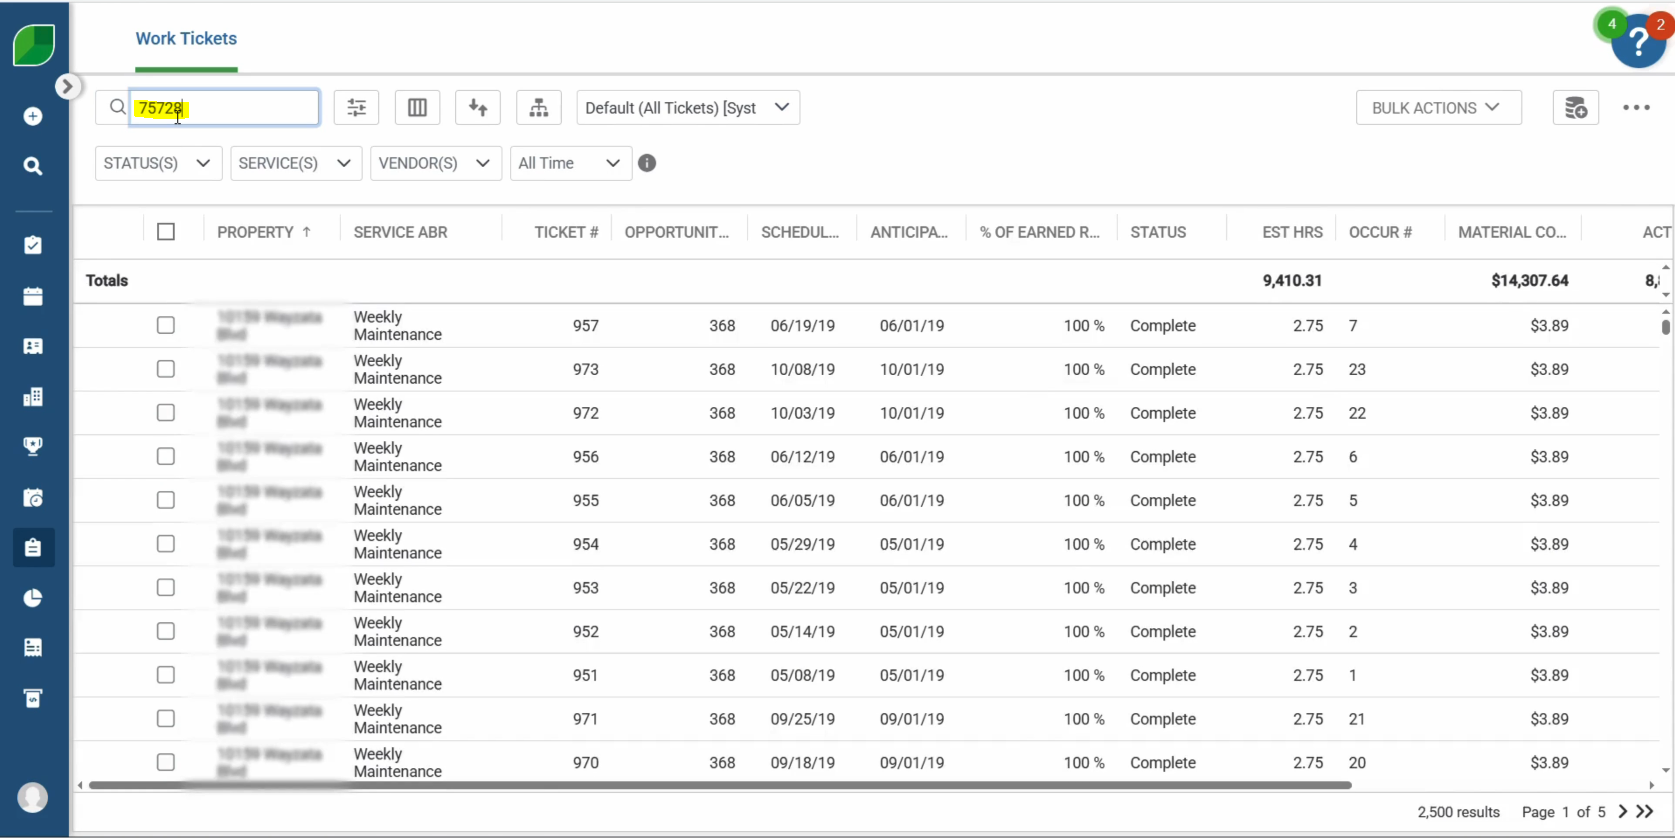
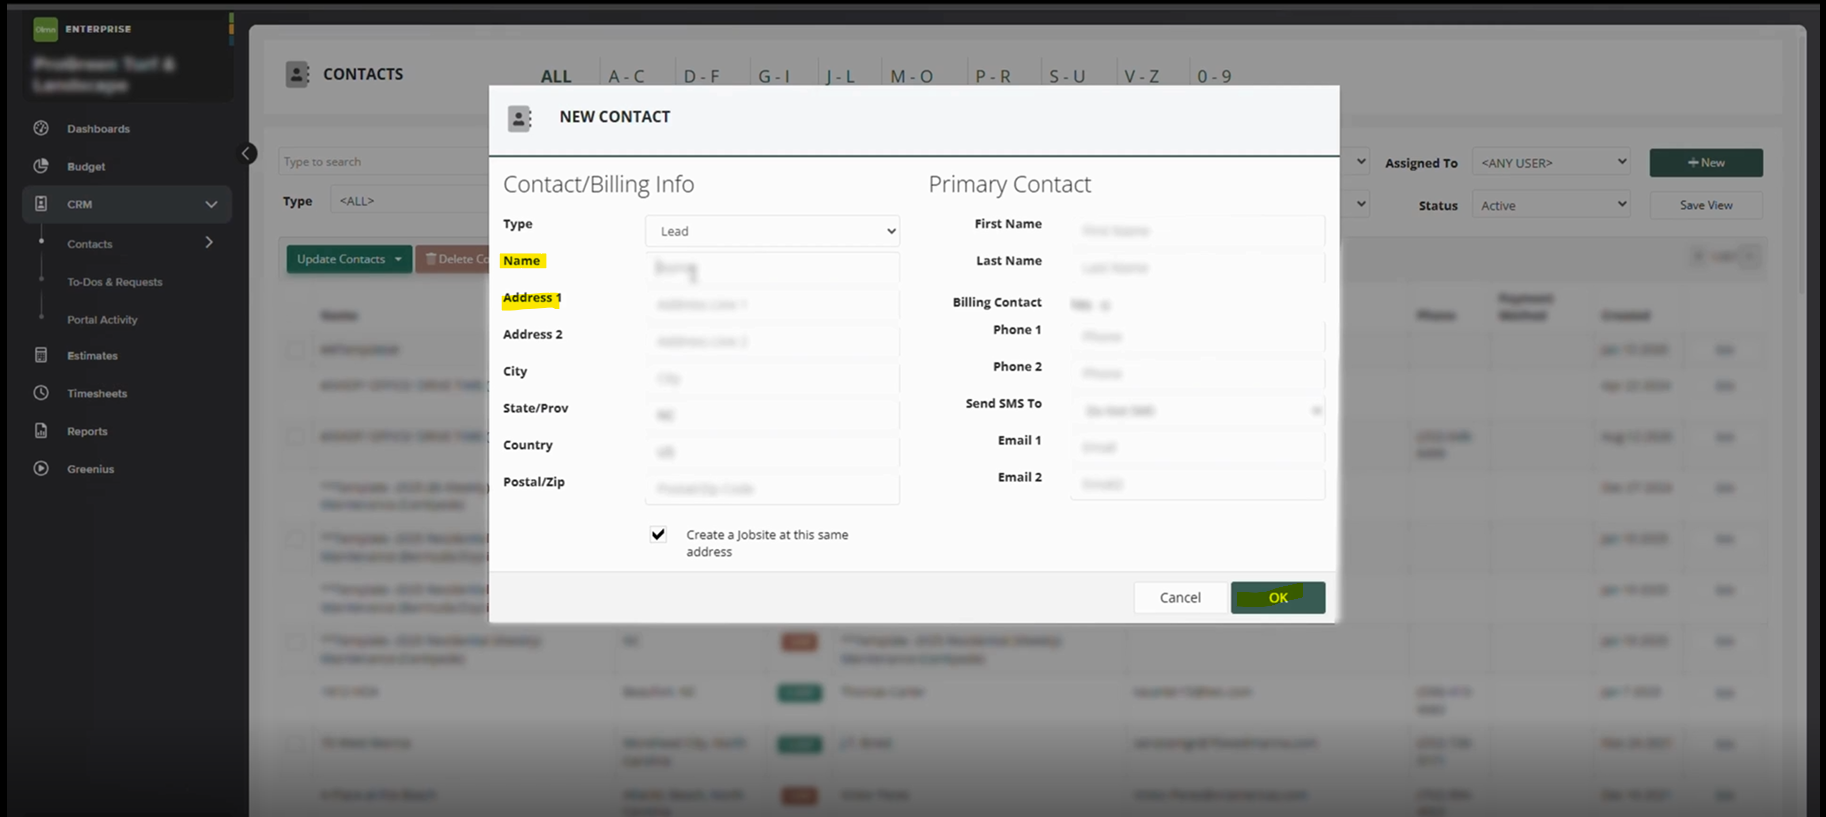
Step 2: Create New Contact
- Go to “Contact” and click on “New” to create a new contact.
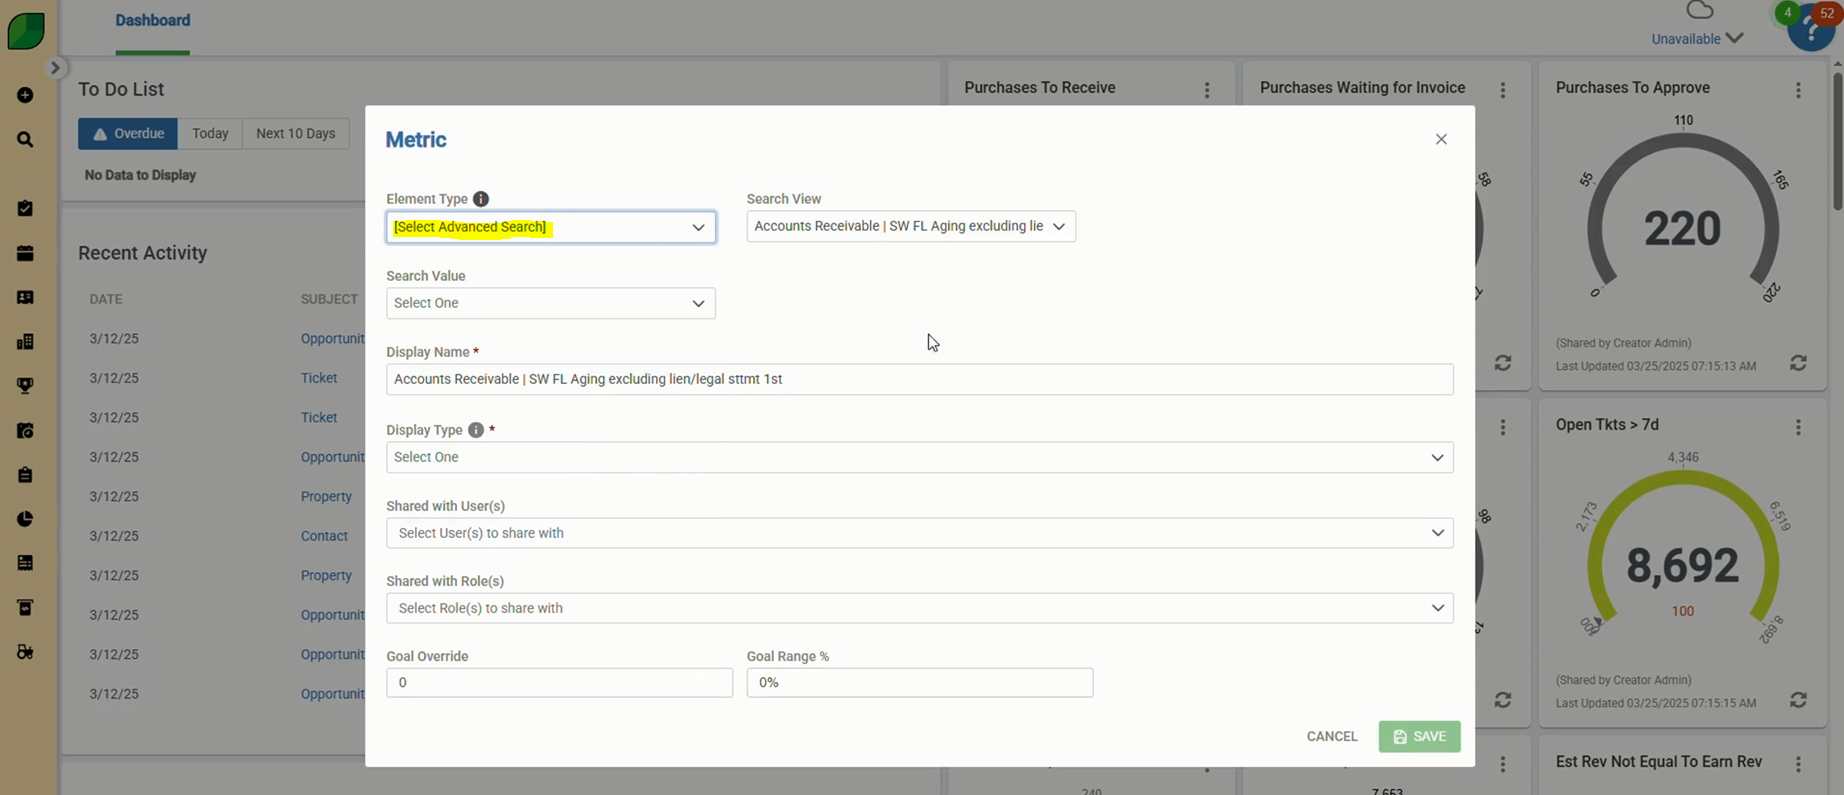
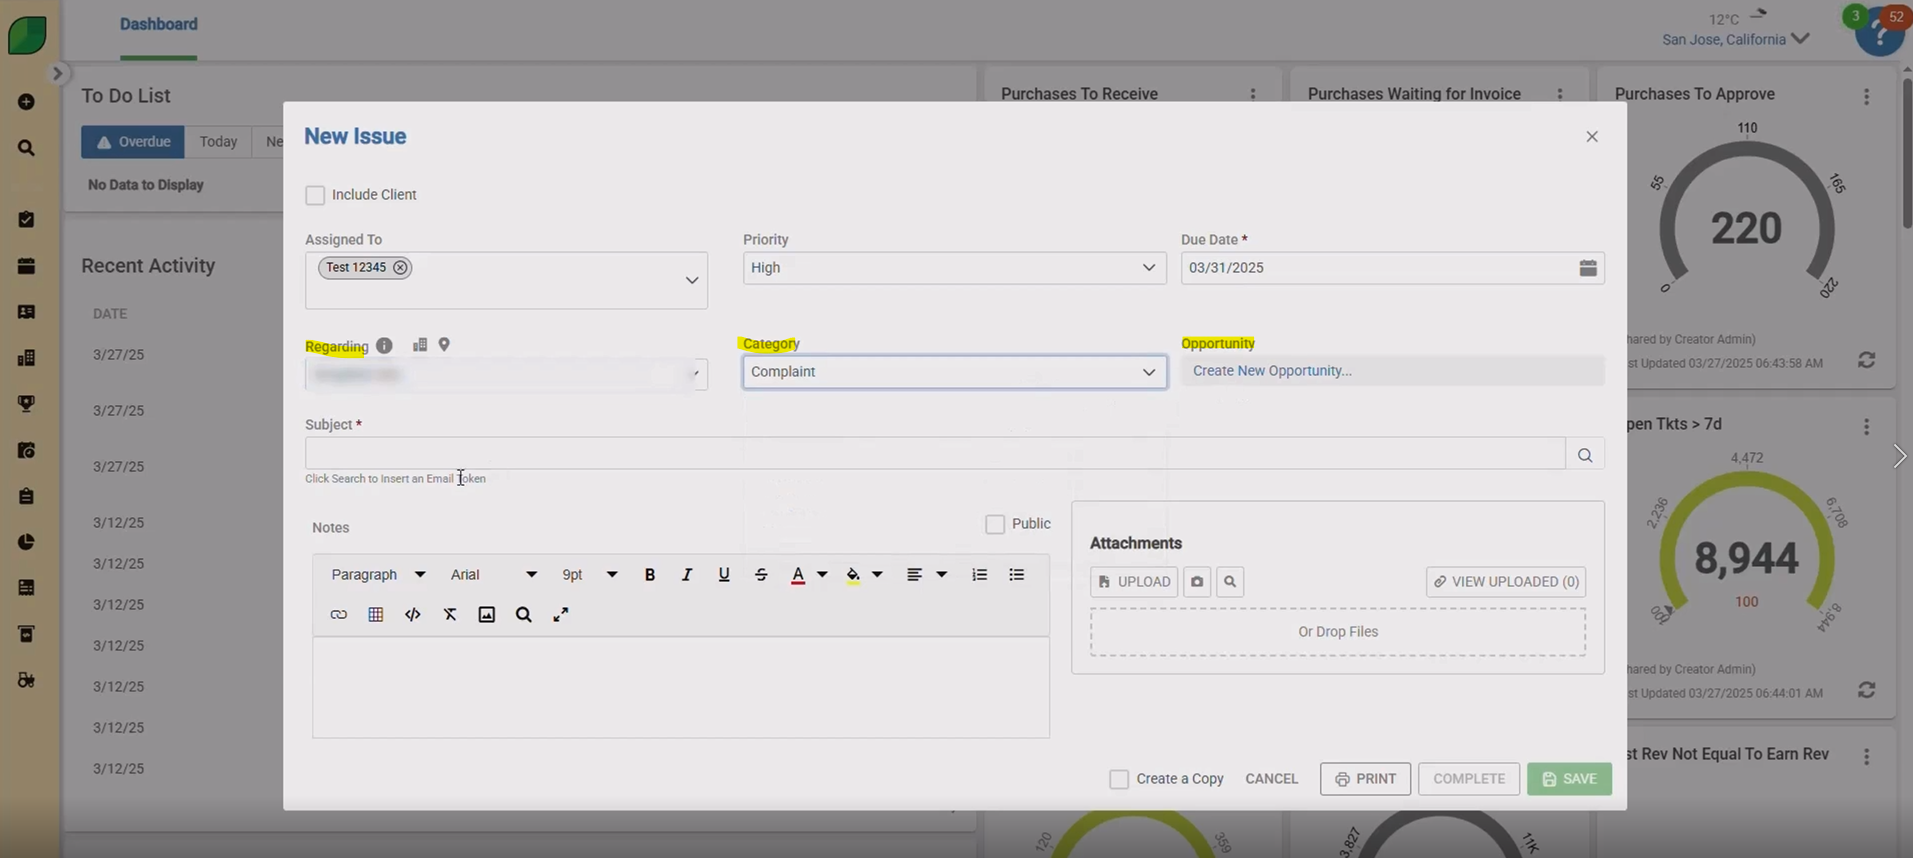
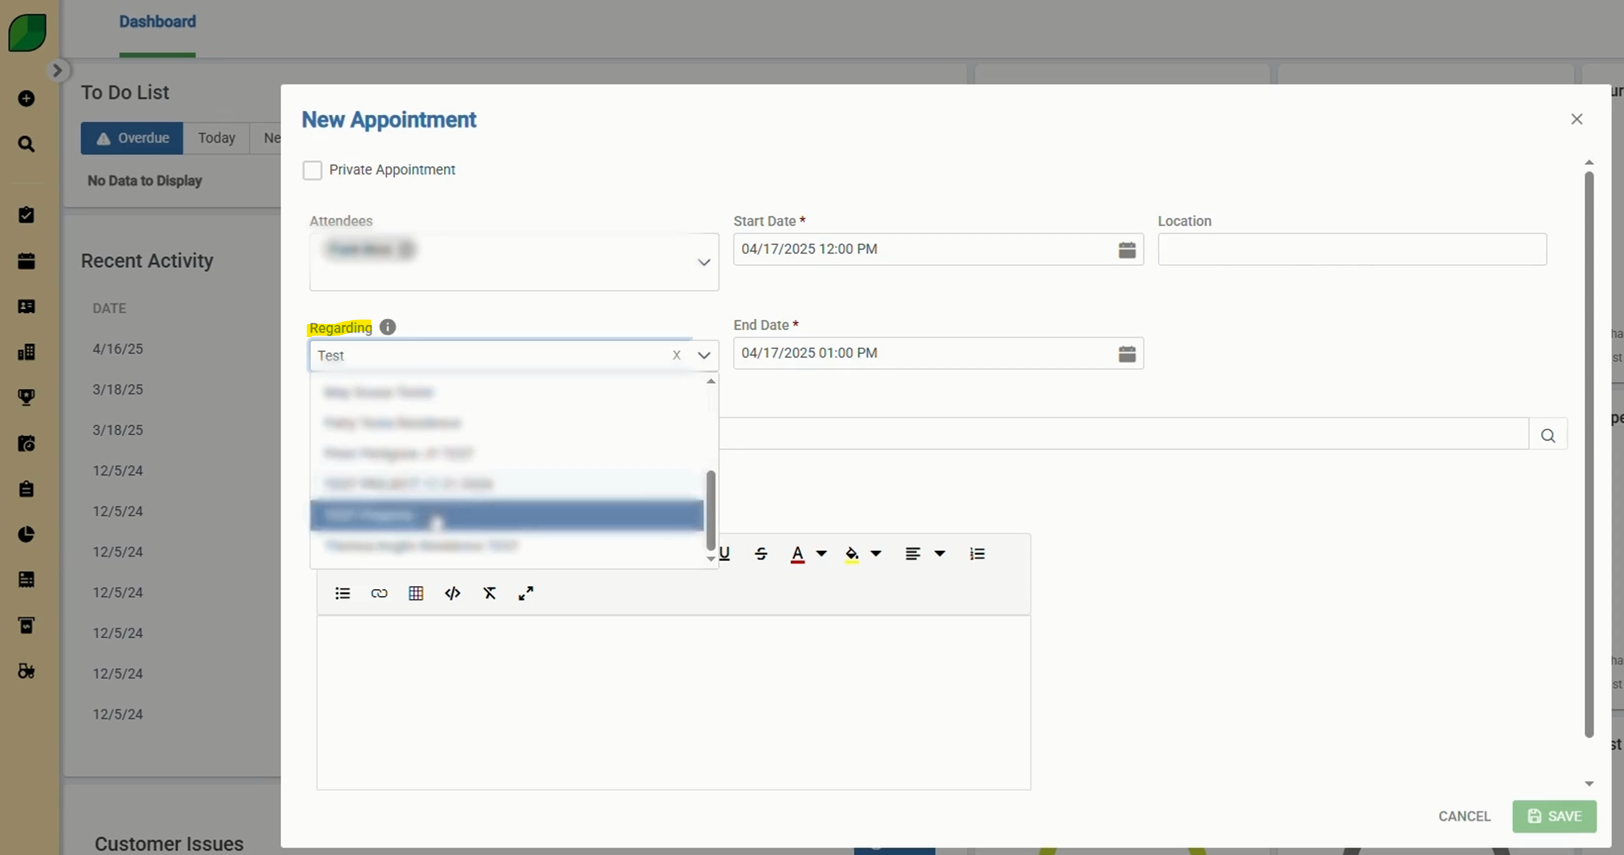
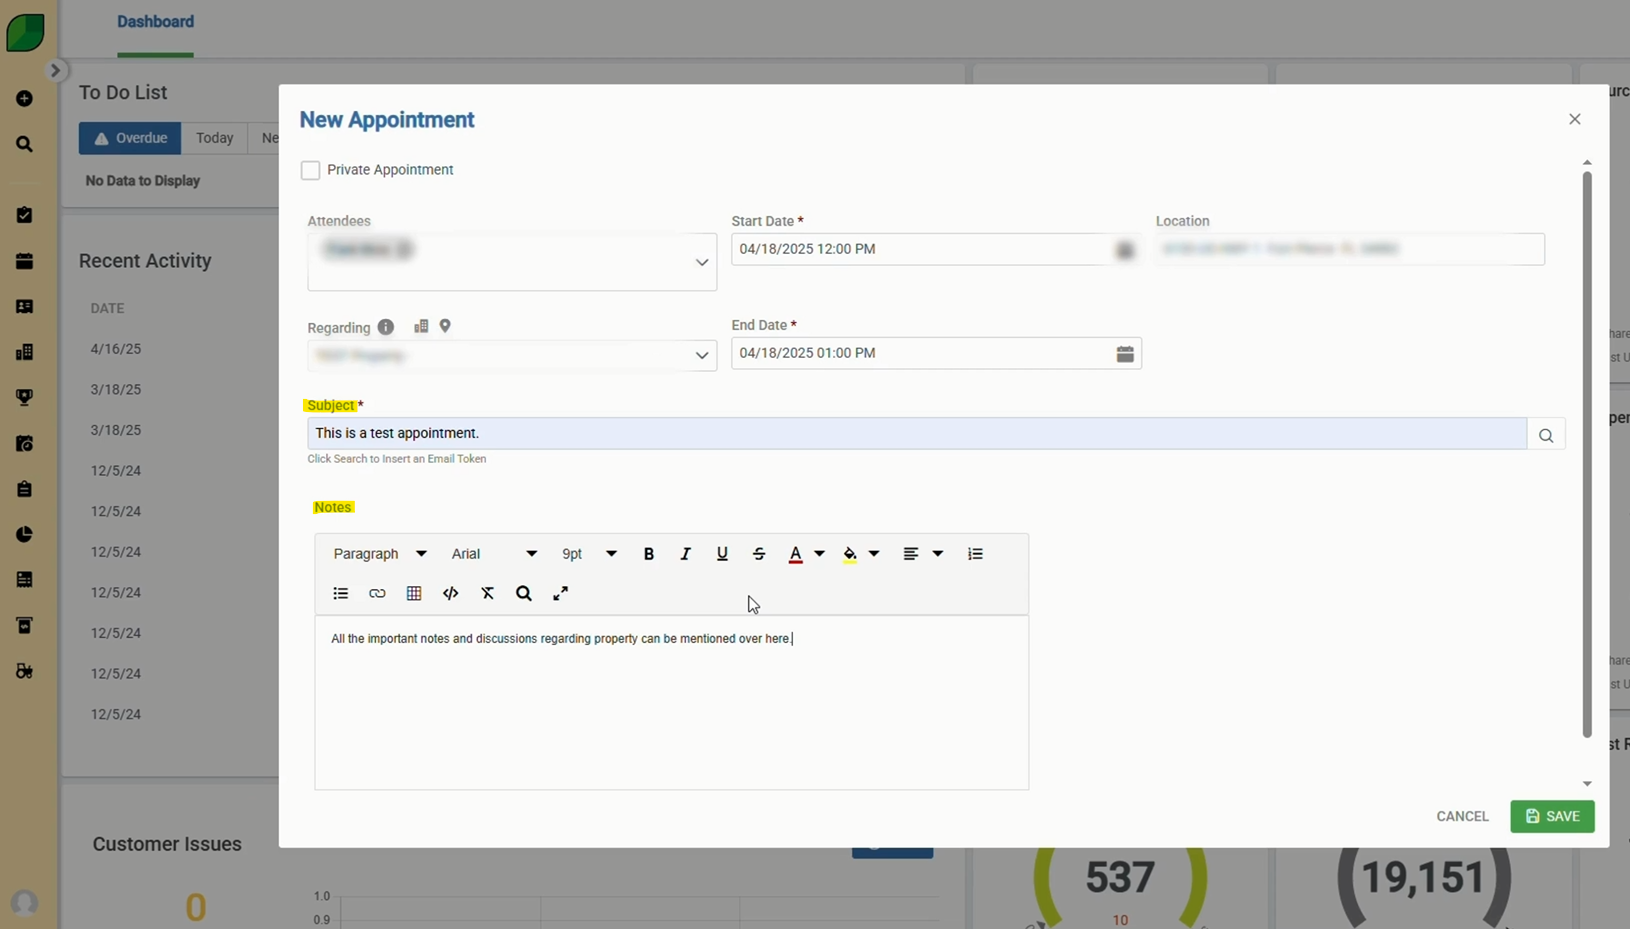
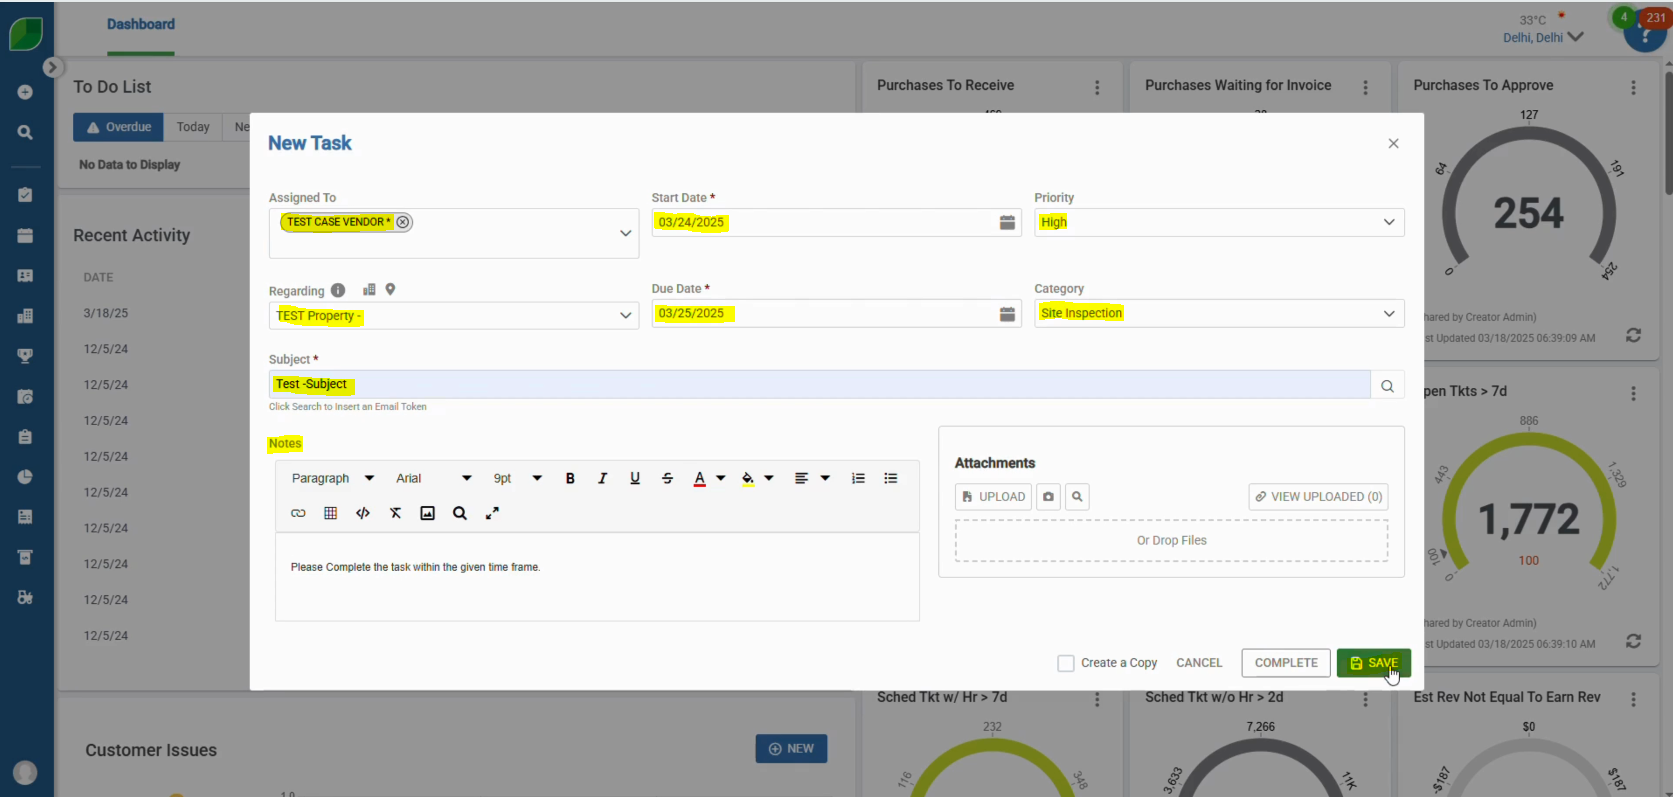
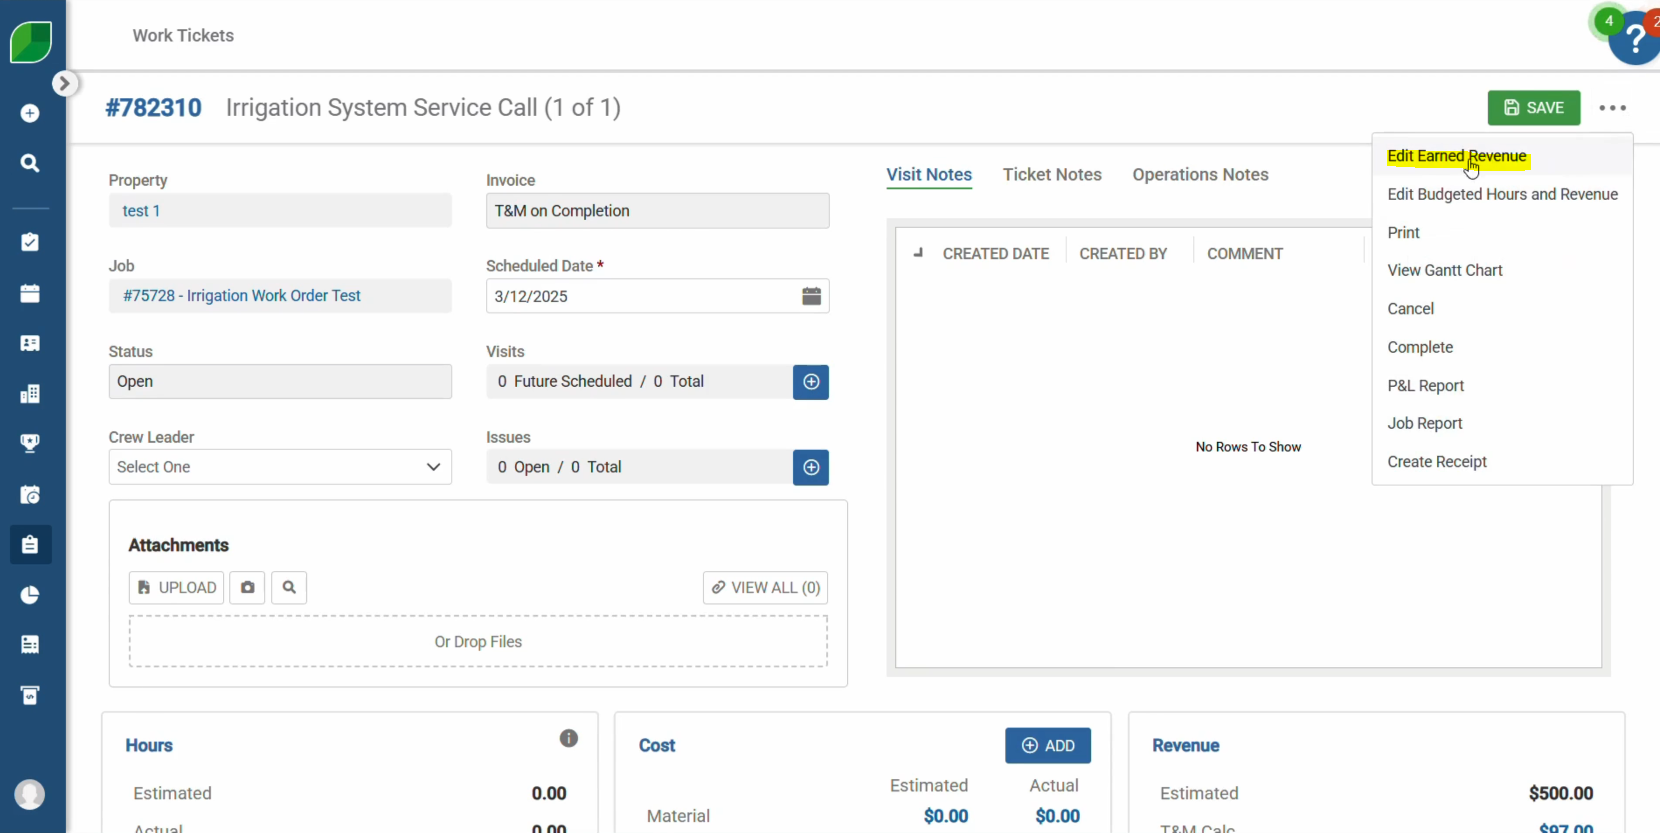
- Enter all required contact details:
- First Name
- Last Name
- Address
- Phone Number
- Email Address
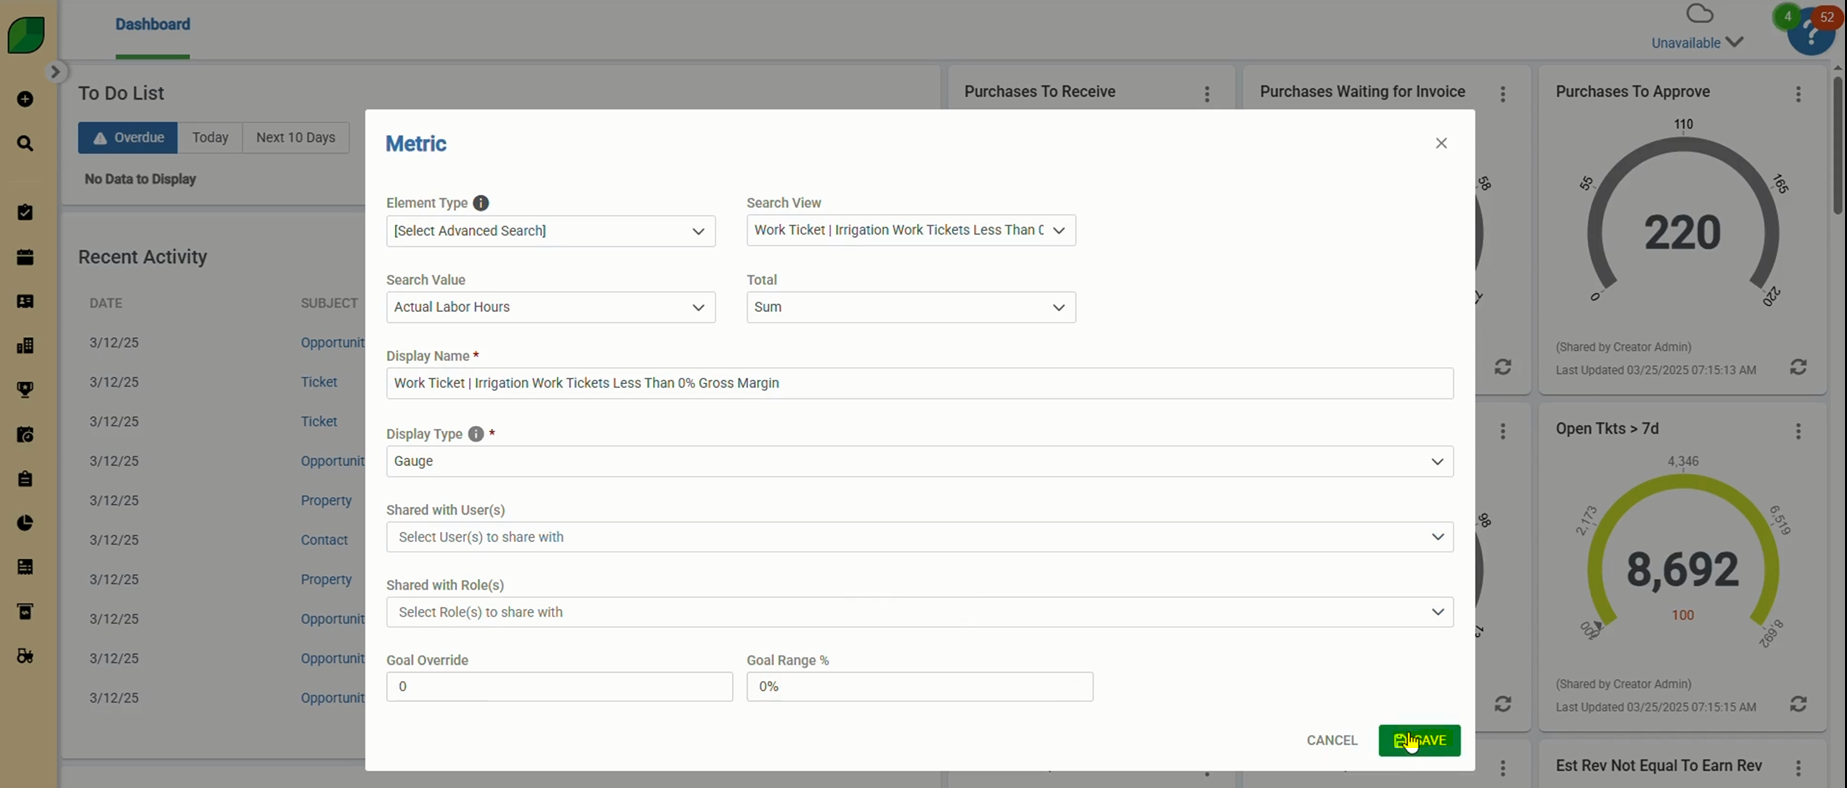
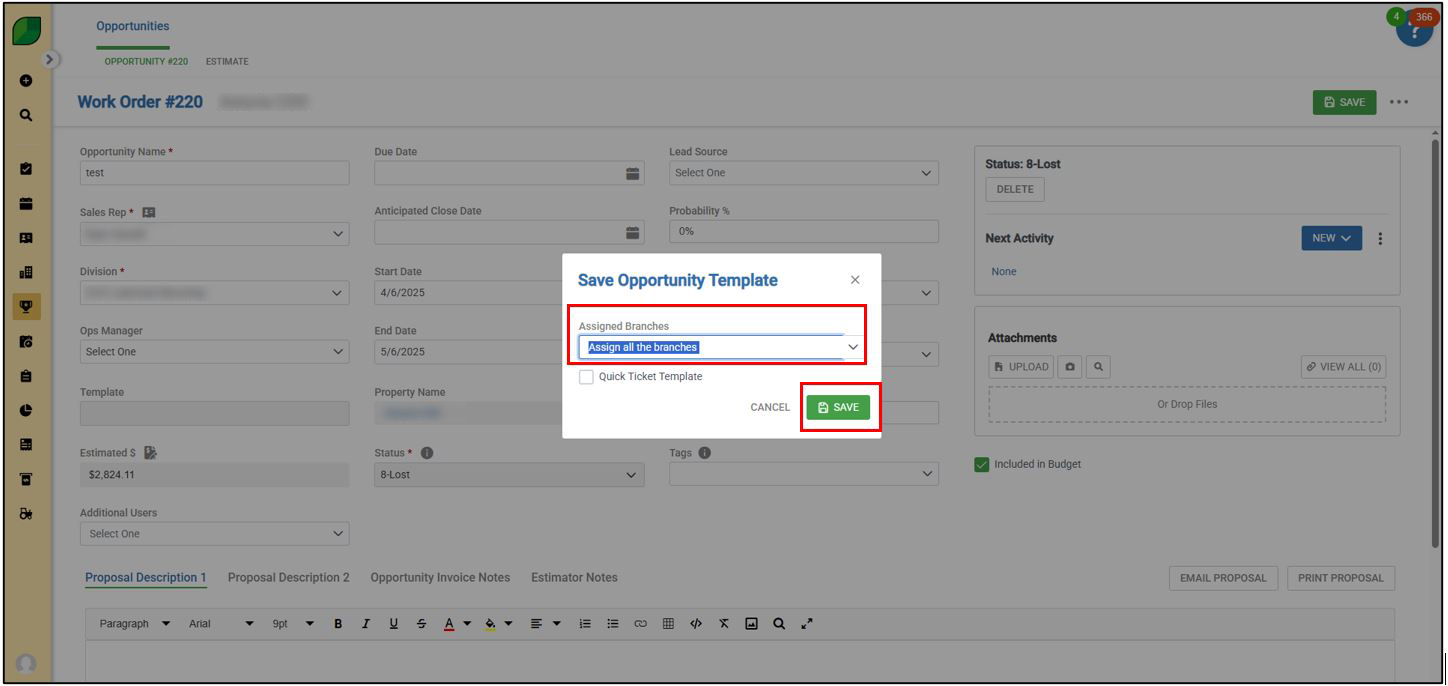
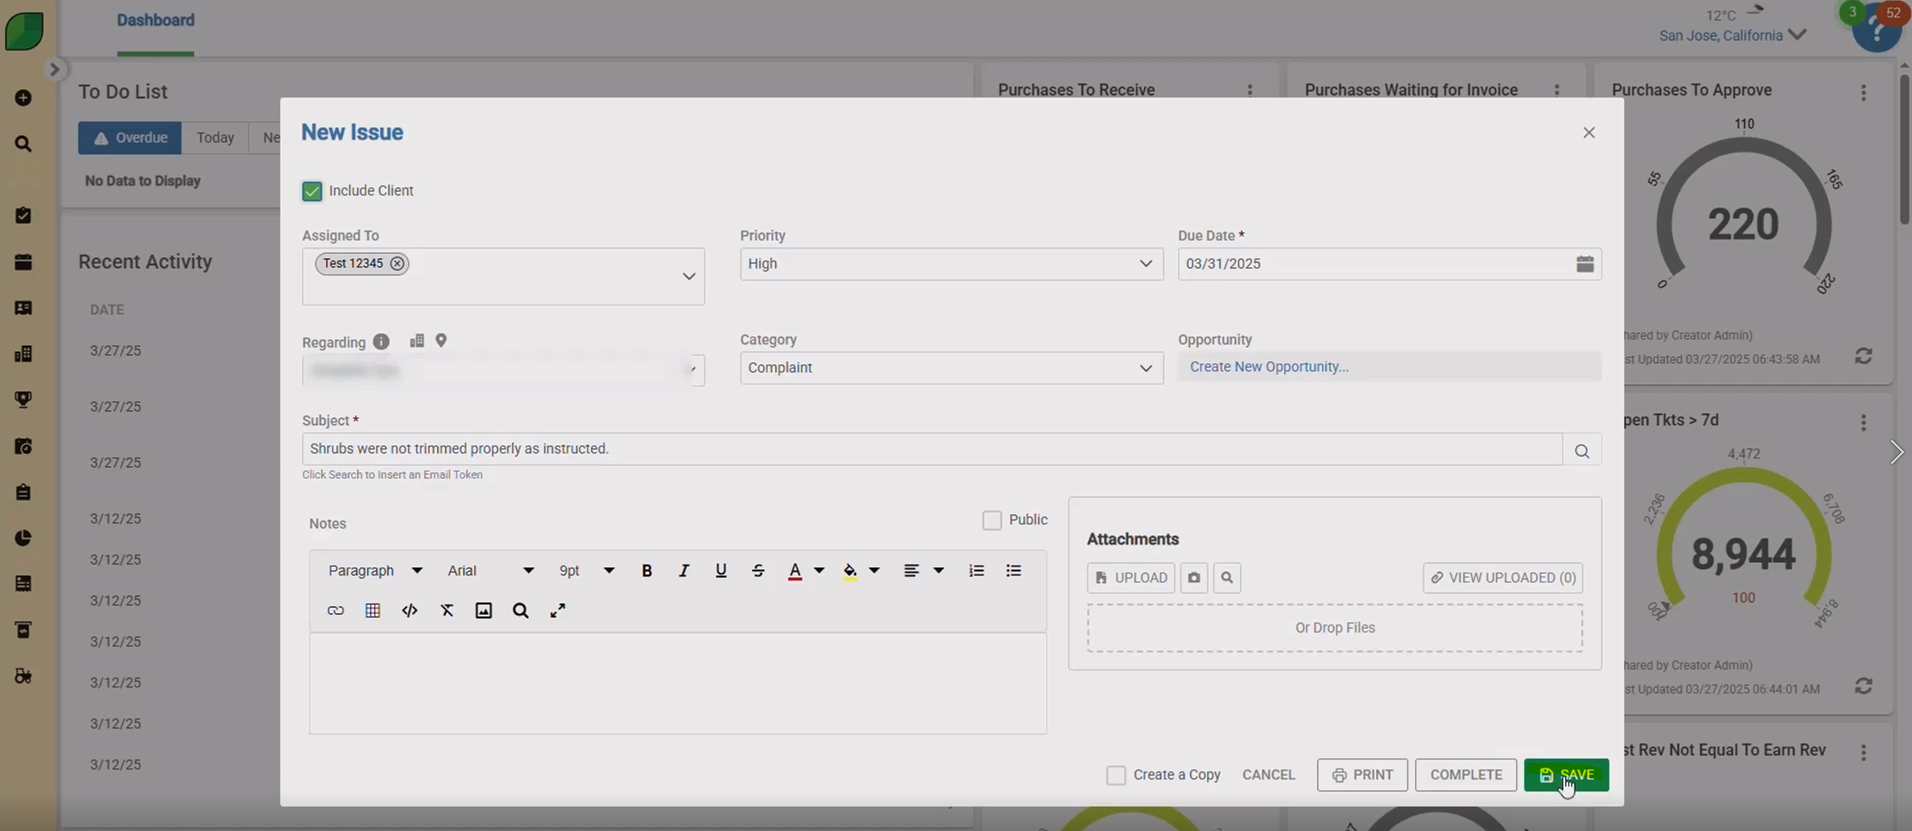
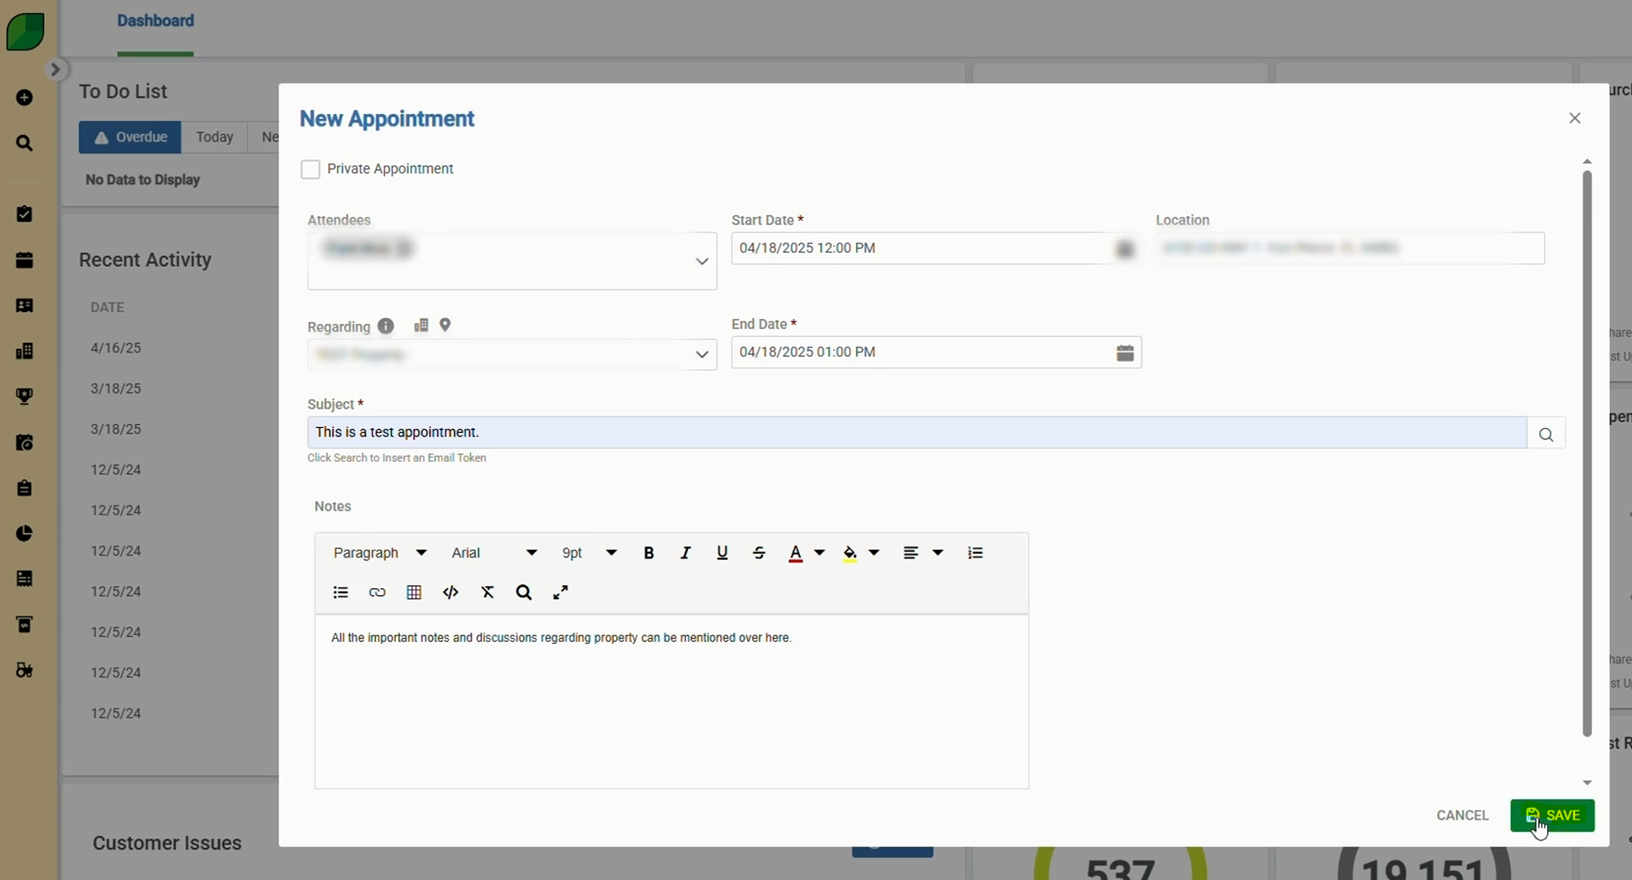
- Click “Save” to complete the contact creation.
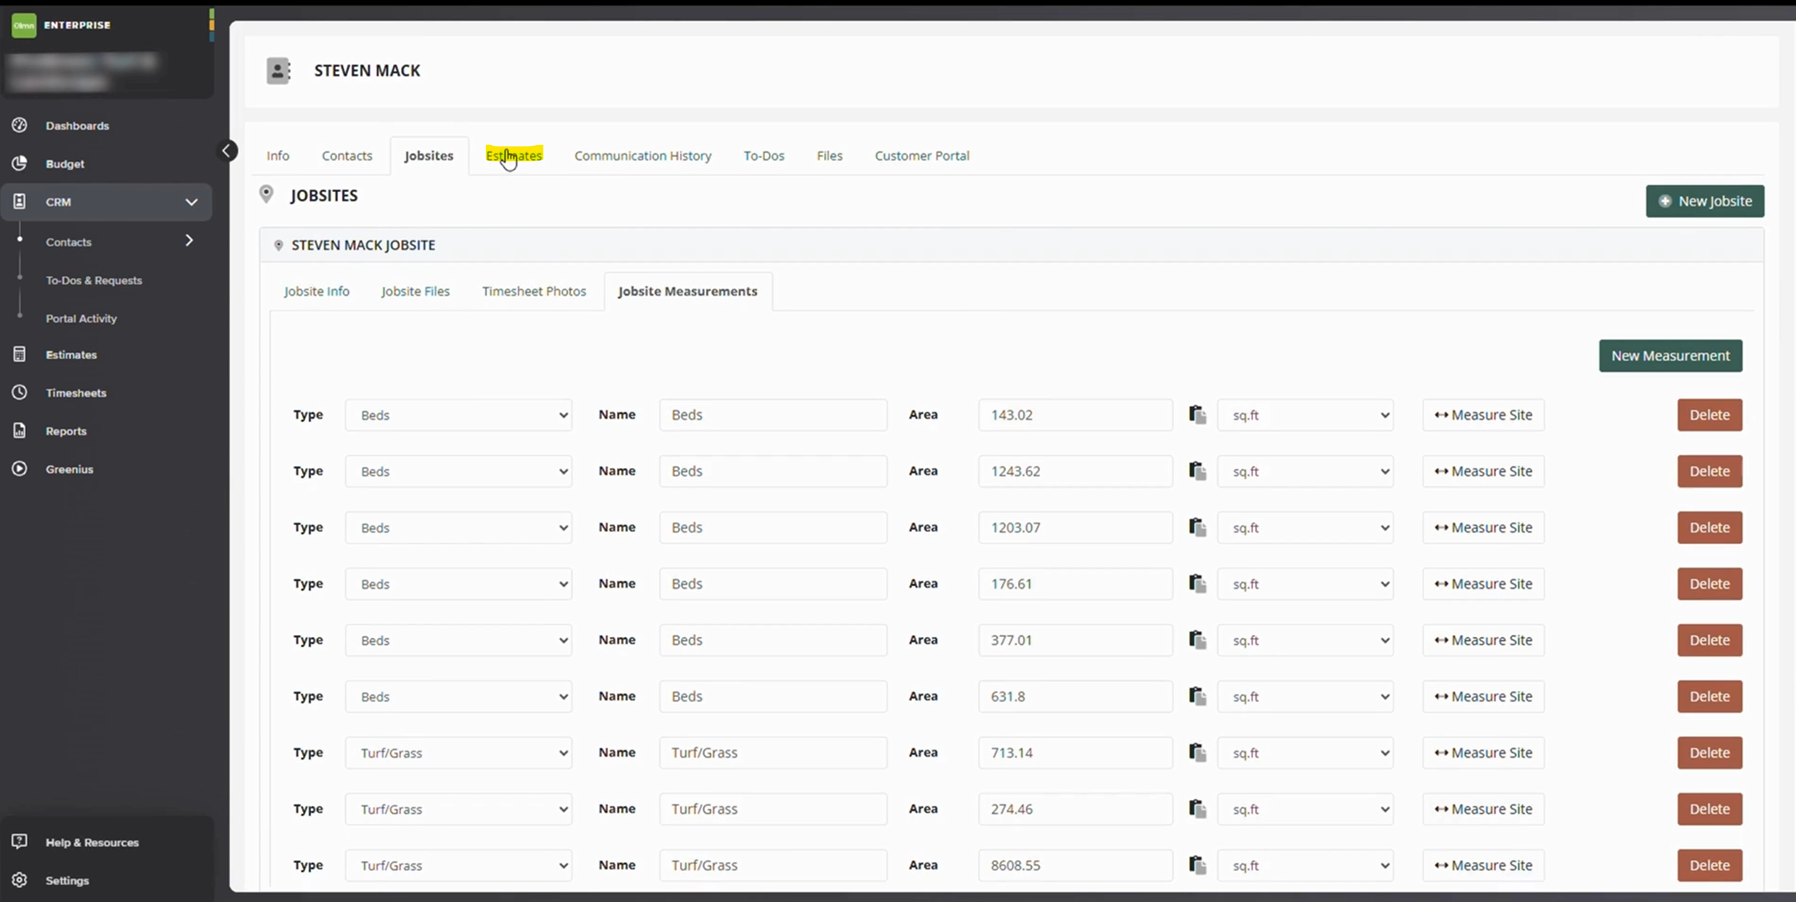
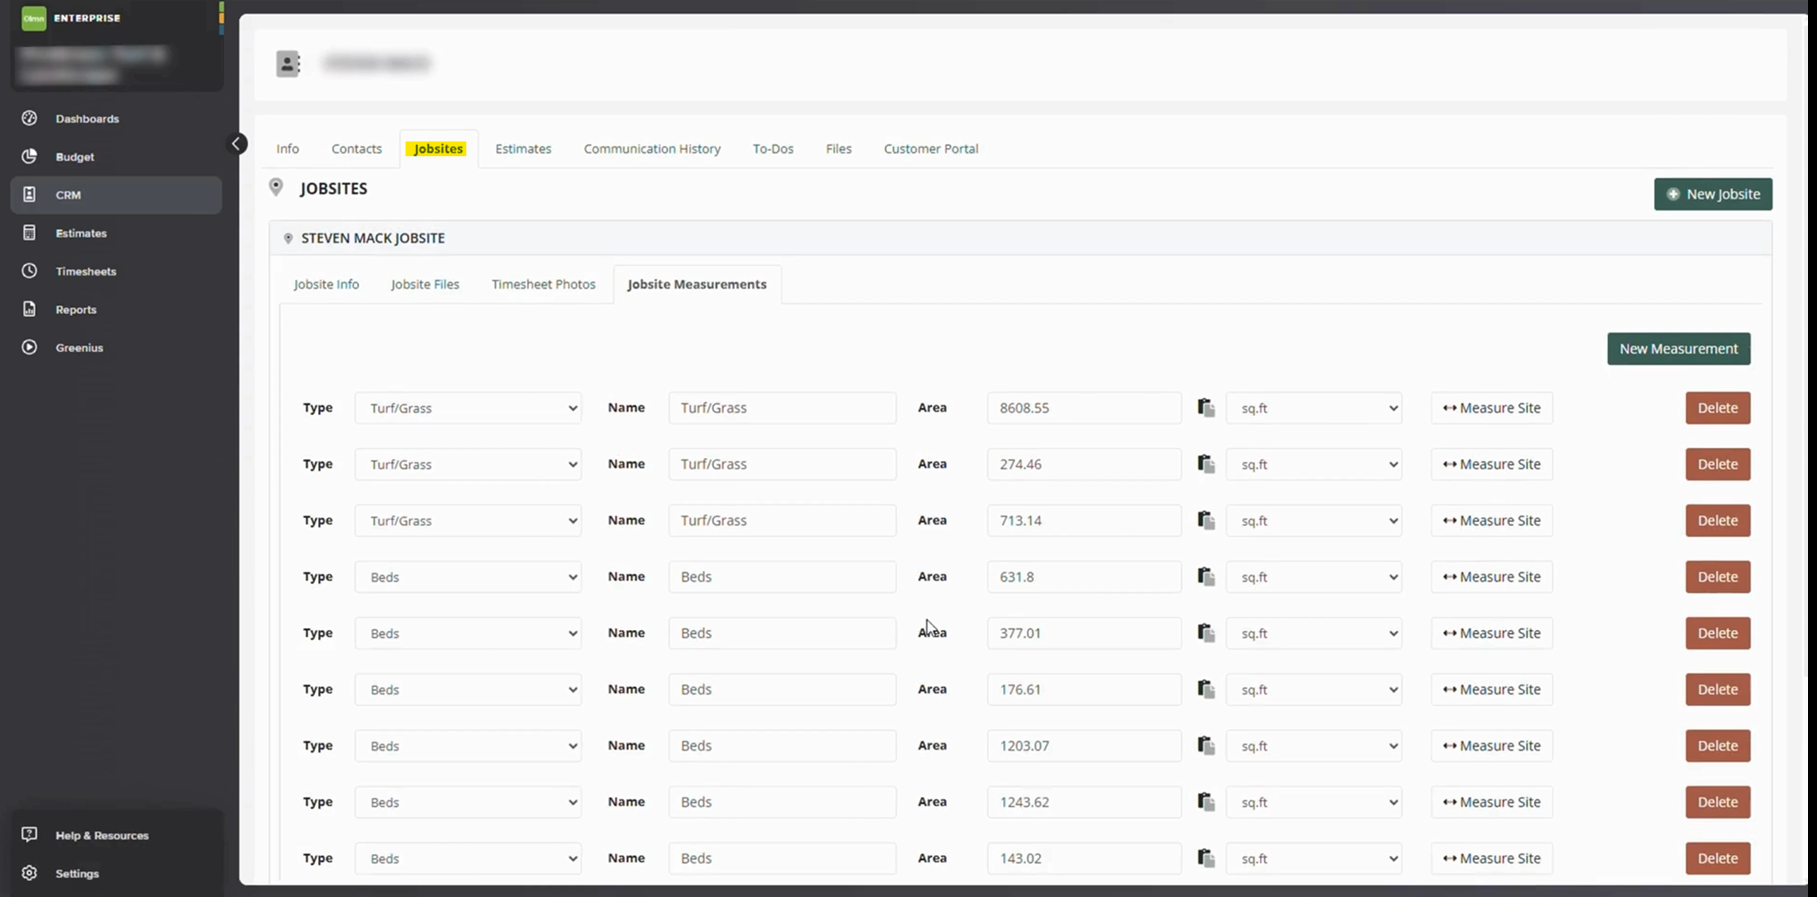
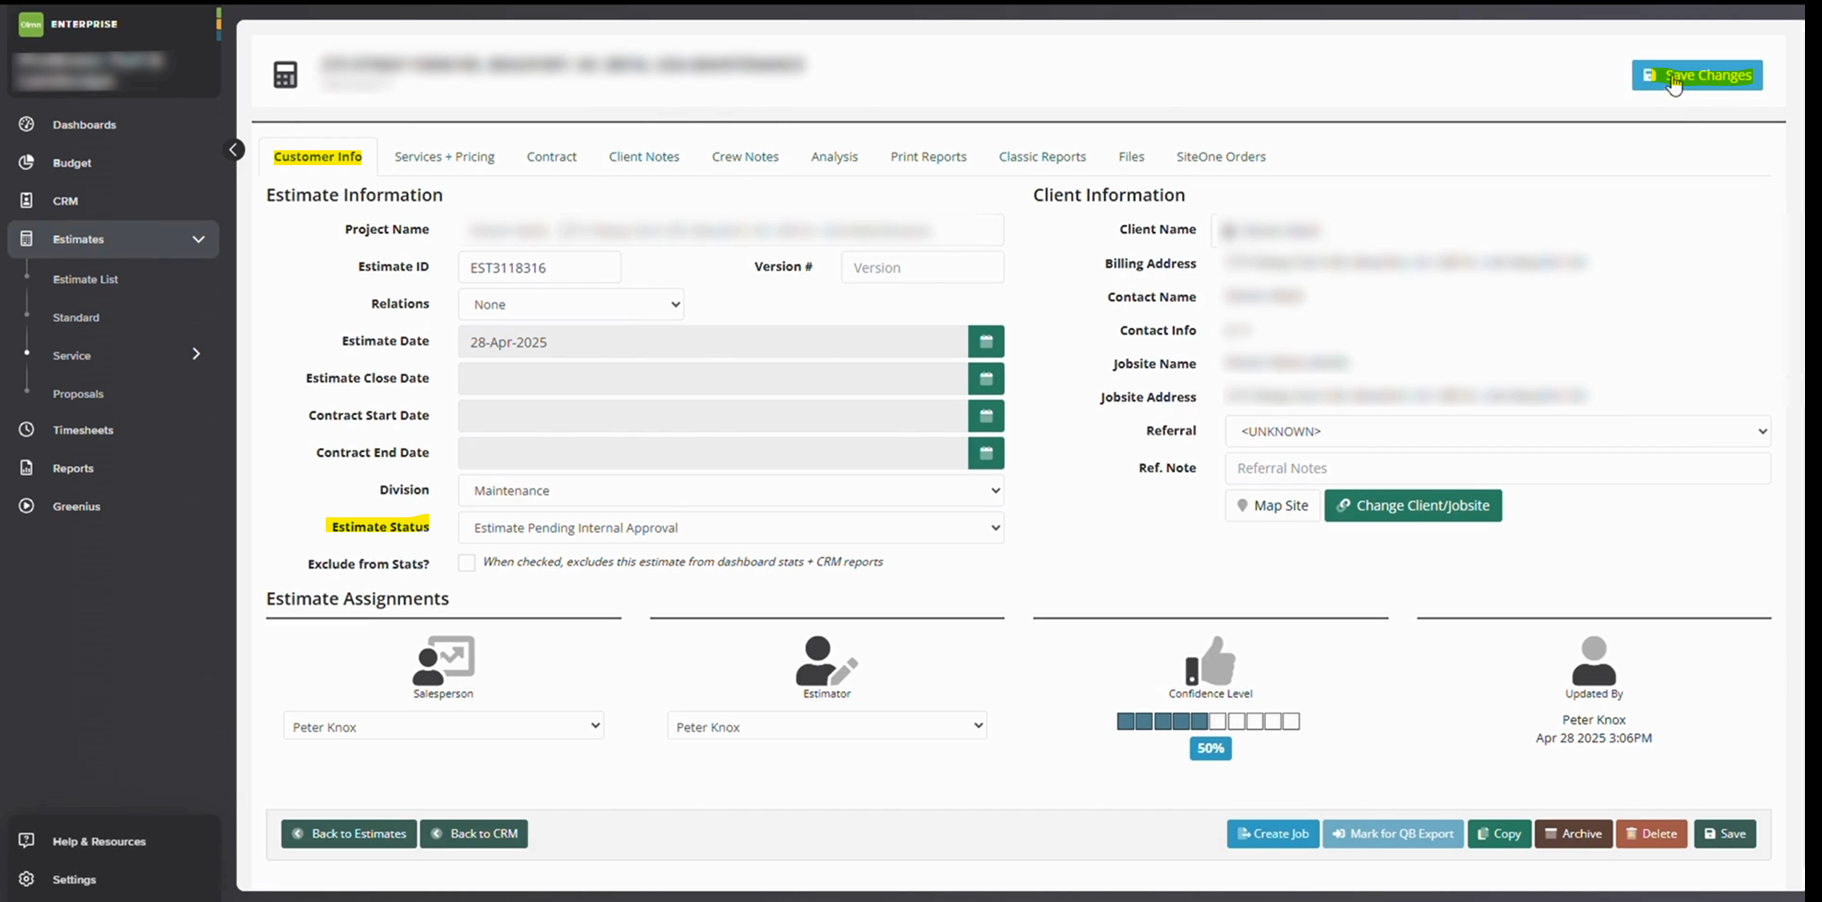
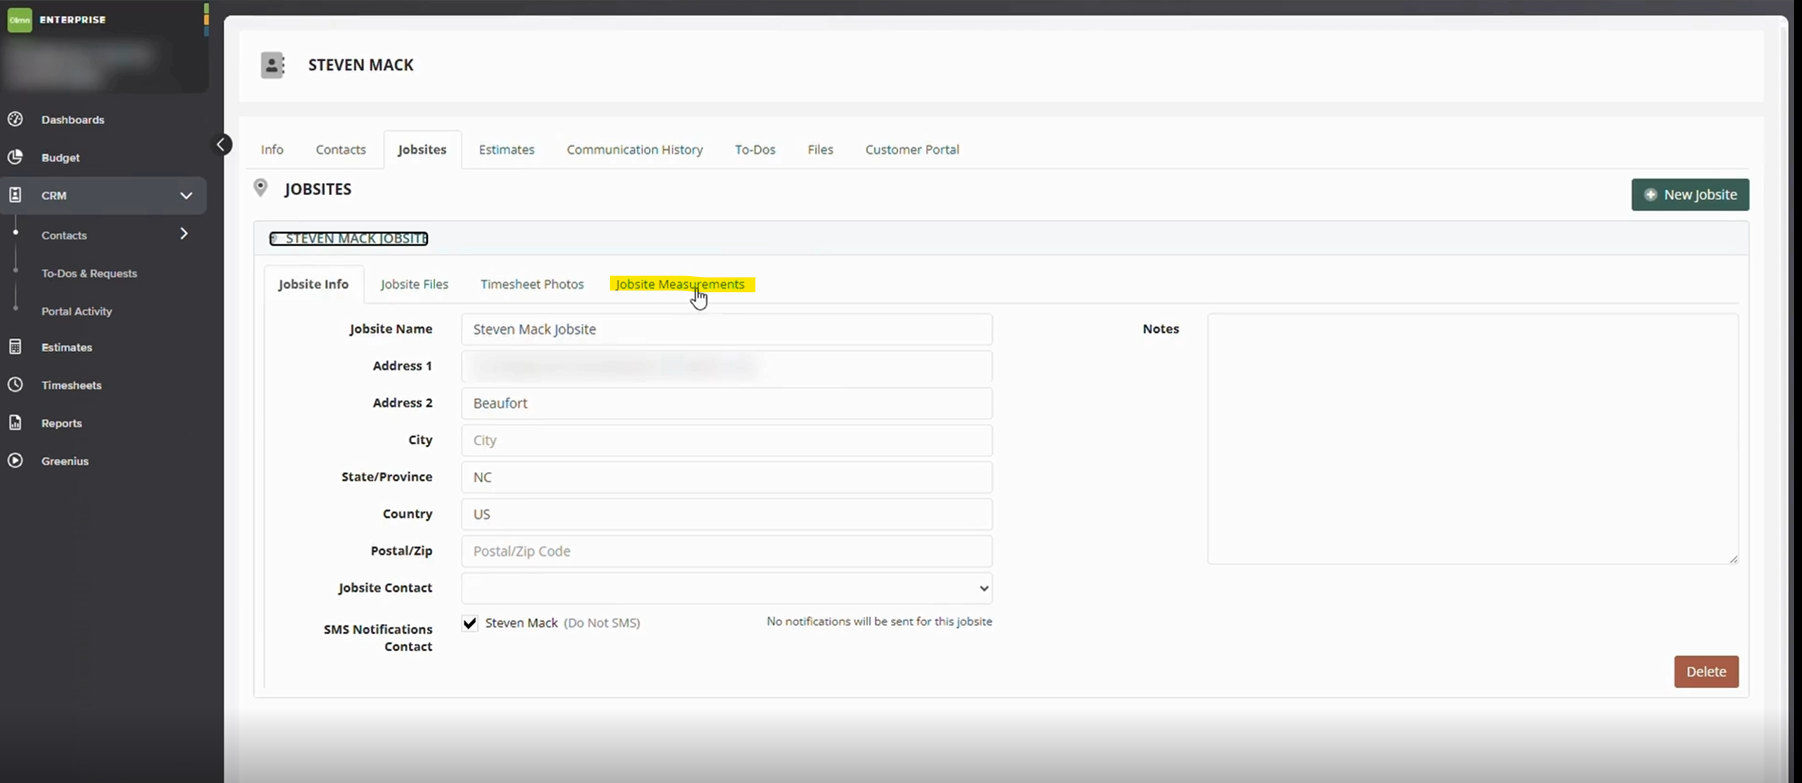
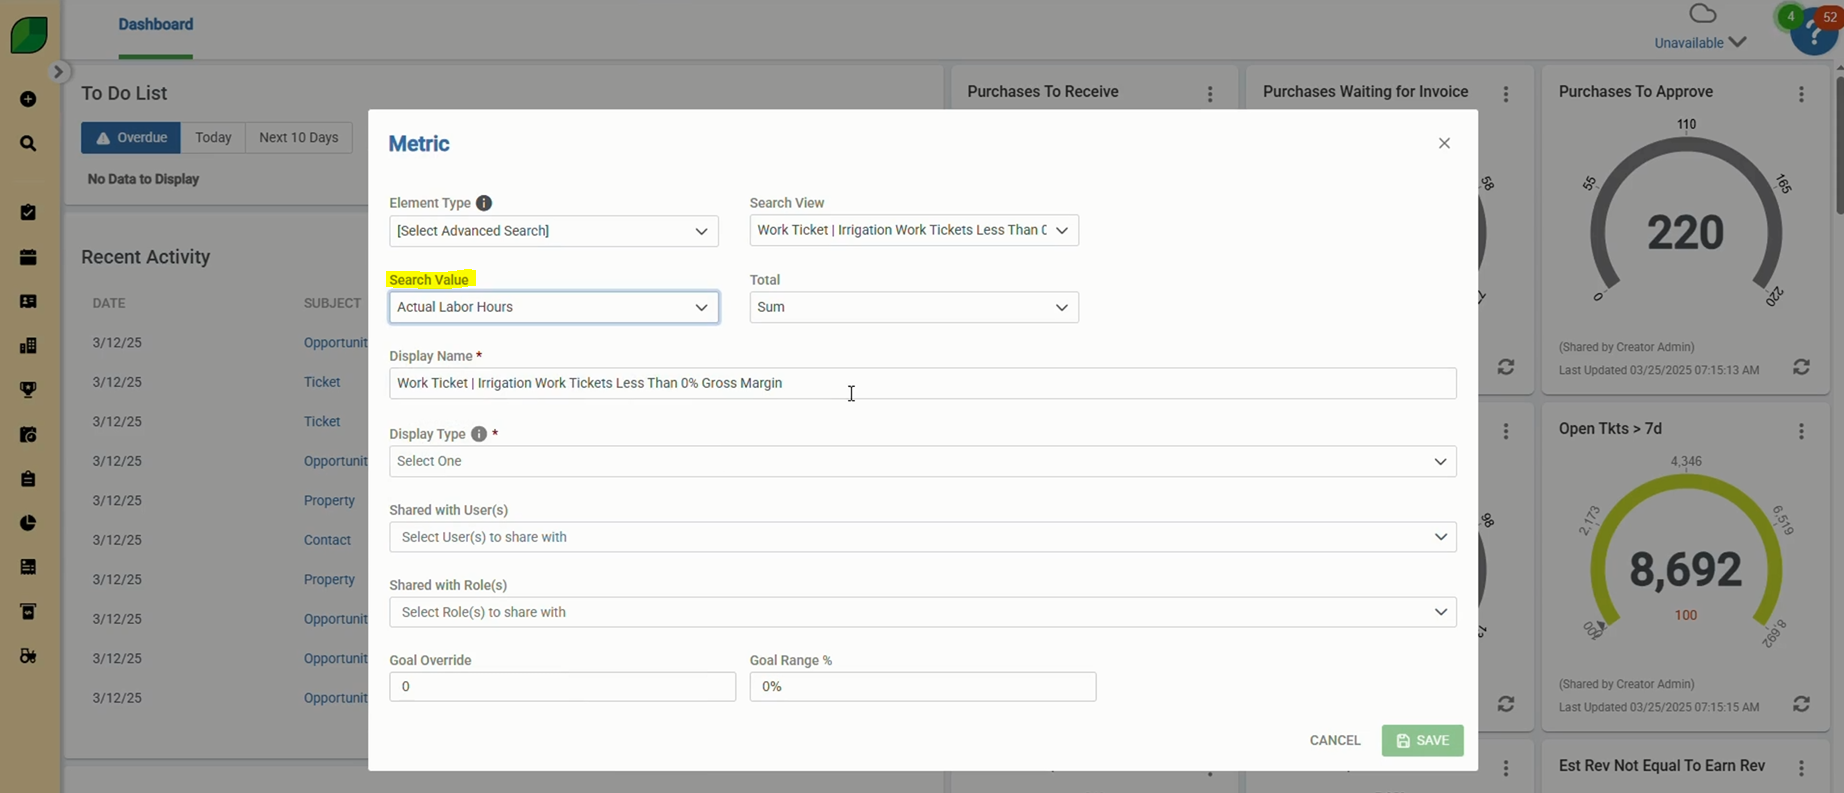
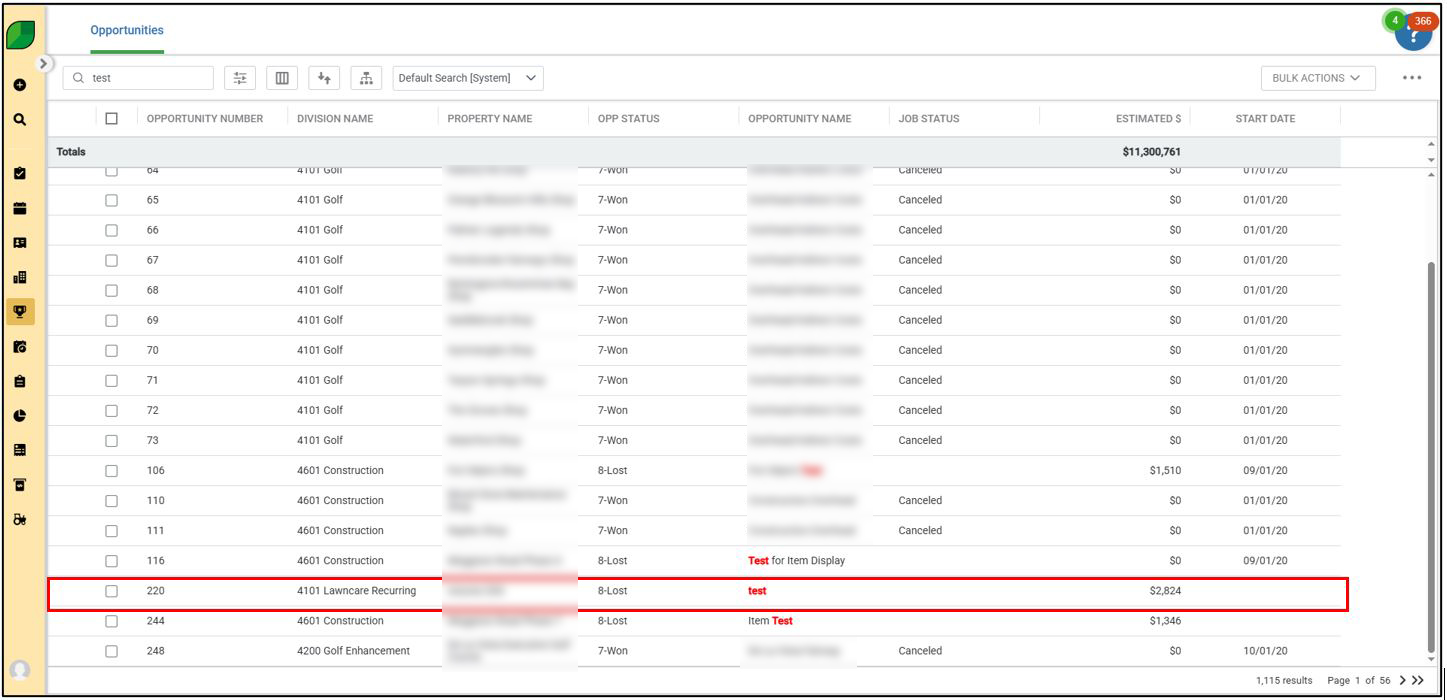
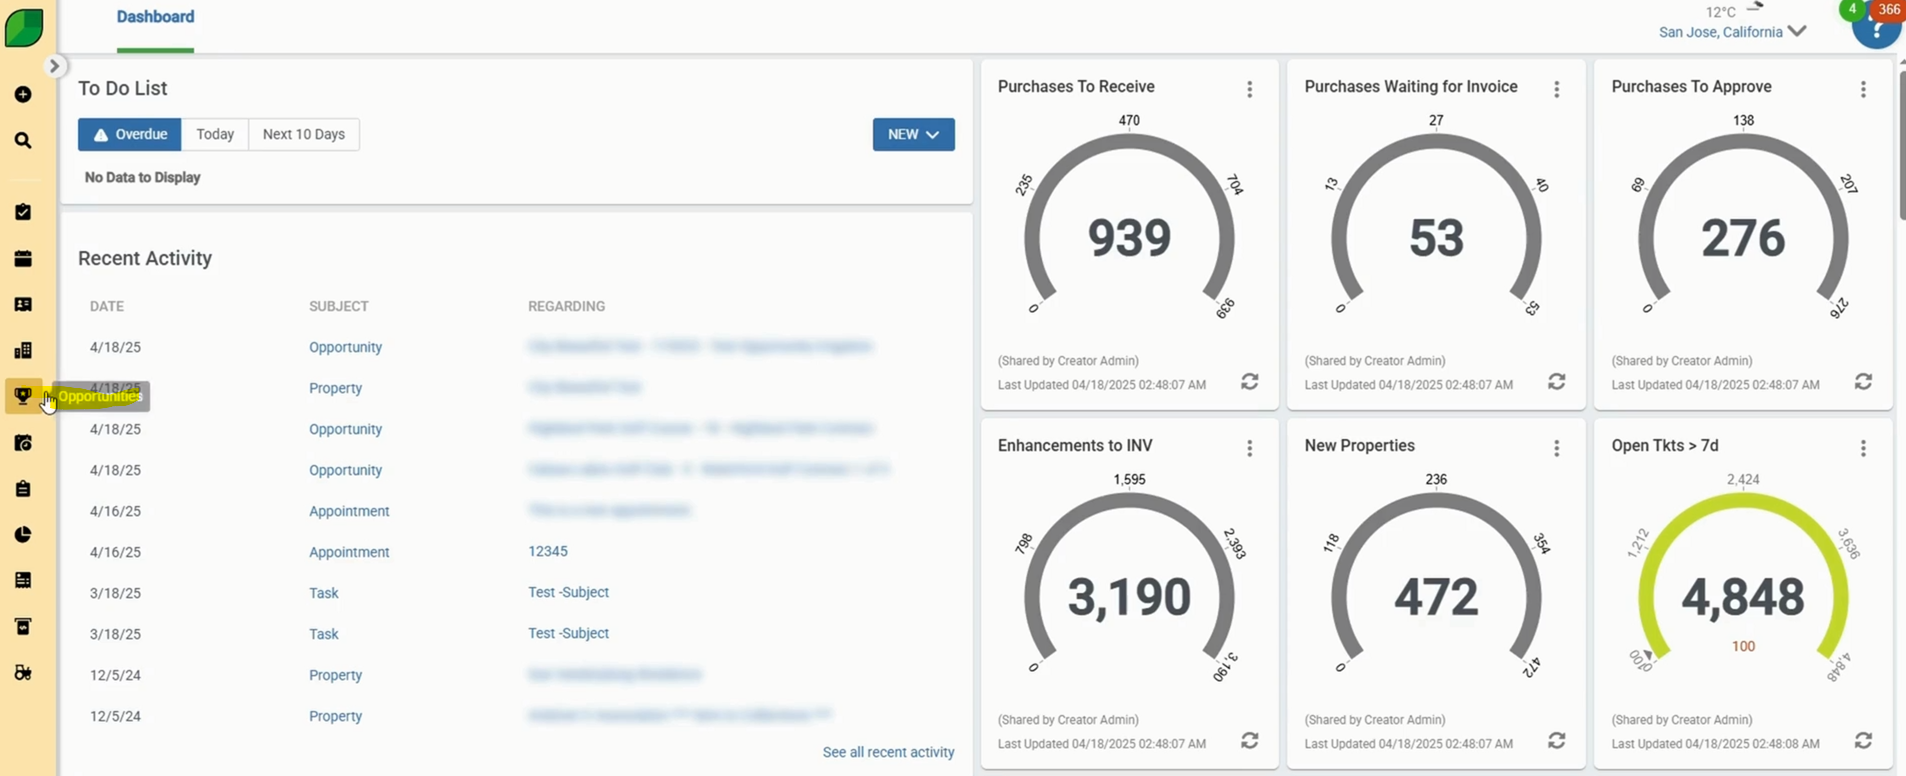
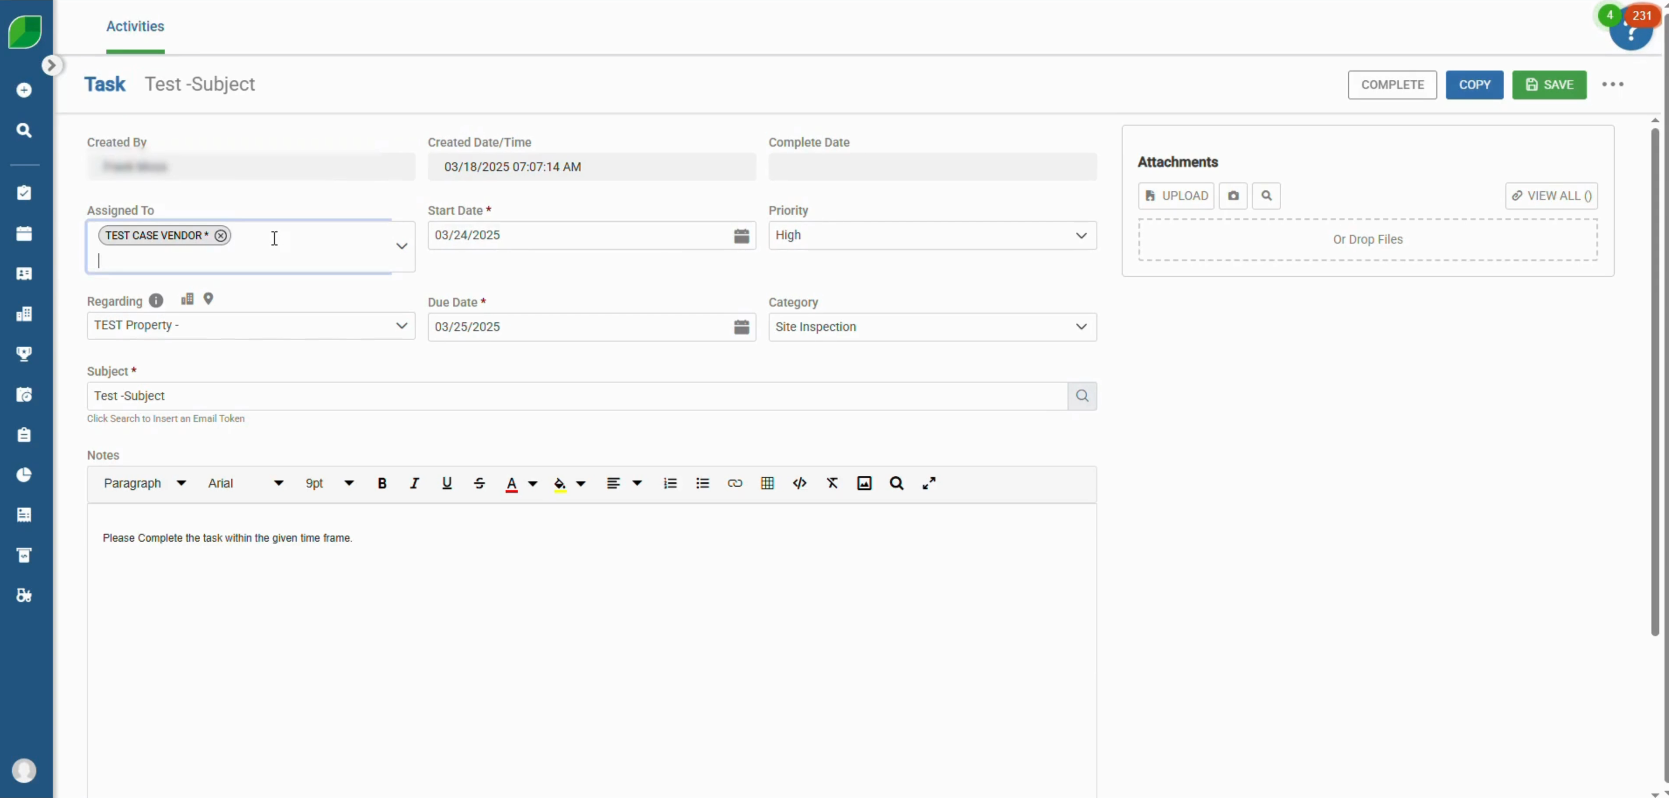
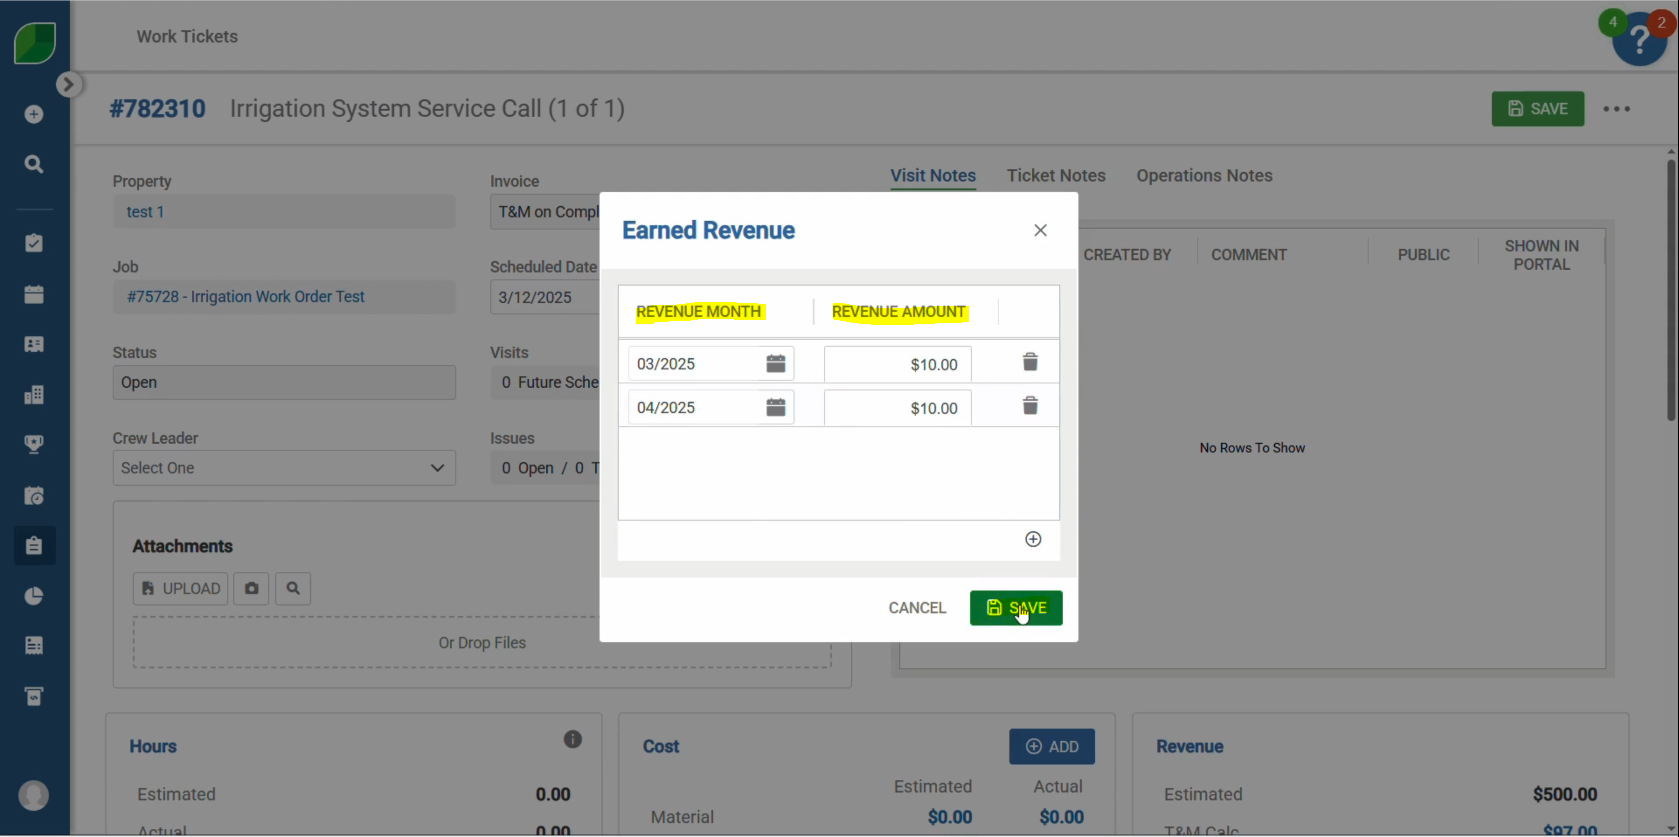
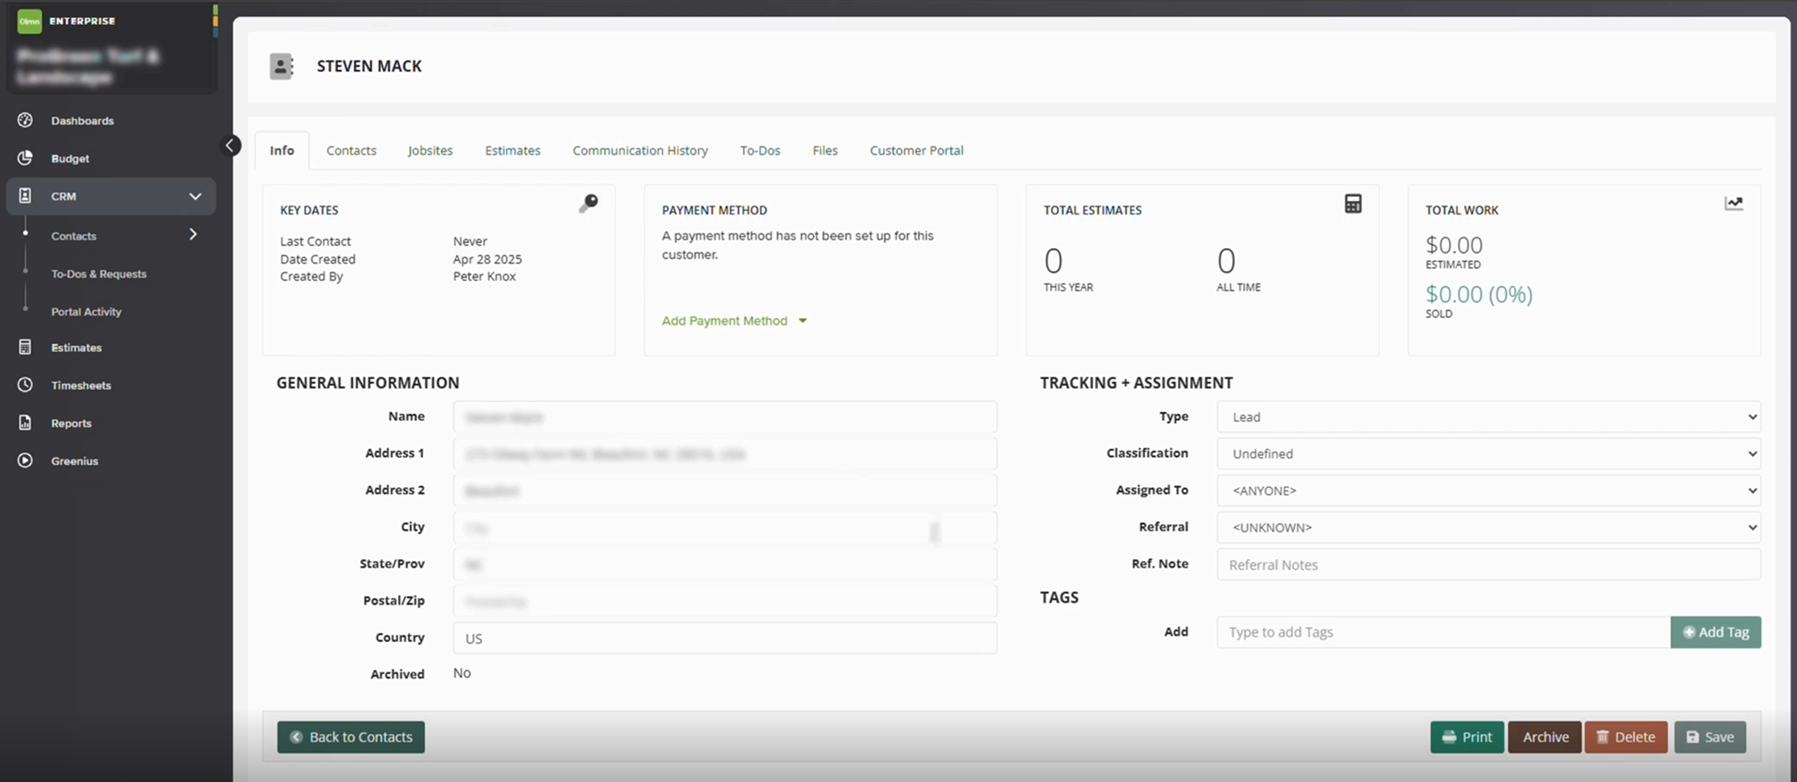
Step 4: Verify Contact Details
- Review all the contact details
Following these steps ensures that every new contact is recorded properly in LMN, which helps maintain organized customer data and deliver consistent service. Accurate CRM usage also enhances communication between teams and supports informed decision-making for project planning and client follow-up.
Download a PDF version of the job aide here.