

Metrics in Aspire allow you to track and visualize key data on your dashboard, helping monitor organizational performance. This guide provides a step-by-step process for understanding, creating, and editing metrics to ensure key data is effectively displayed and monitored.
Understanding Metrics
Metrics act like dashboard dials in a truck, allowing users to gauge business performance at a glance.
- Locating Metrics: Metrics can be found in the middle column of your Aspire dashboard.
- Purpose: They help track accounts receivable, work orders, labor hours, and other critical business aspects.
Steps:
1. Access Your Dashboard
- Log in to your Aspire account.
- Navigate to the main dashboard, where you can track and manage key metrics.
2. Open the “Purchase to Receive” Options
- Locate the “Purchase to Receive” section in your dashboard.
- Click on the three dots next to this section to open additional options.
- From the dropdown menu, select New to begin creating a new metric.
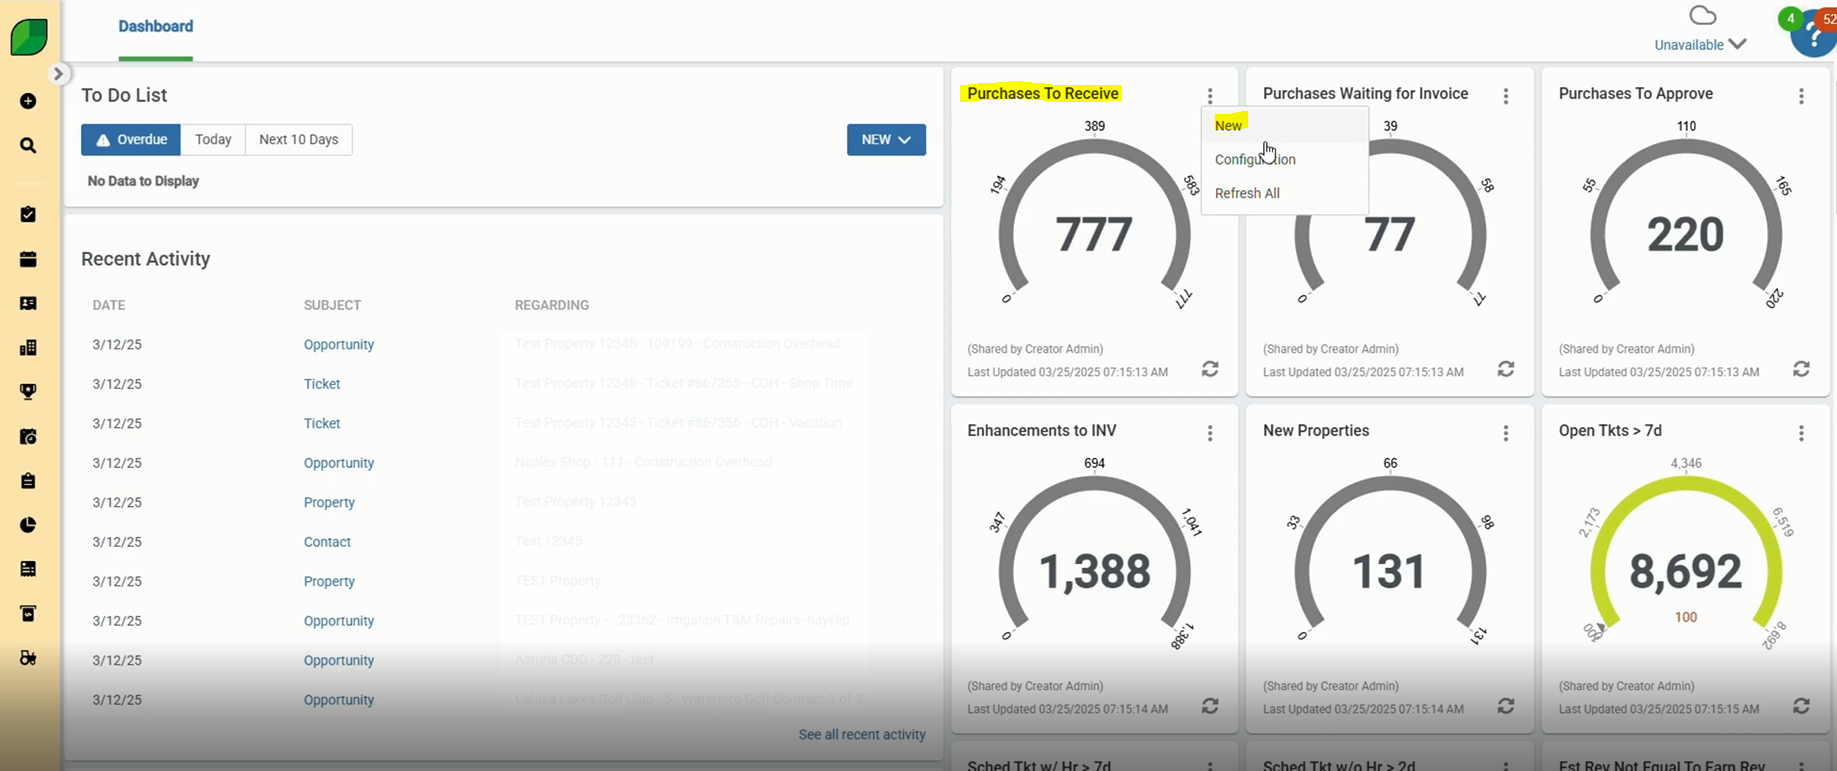
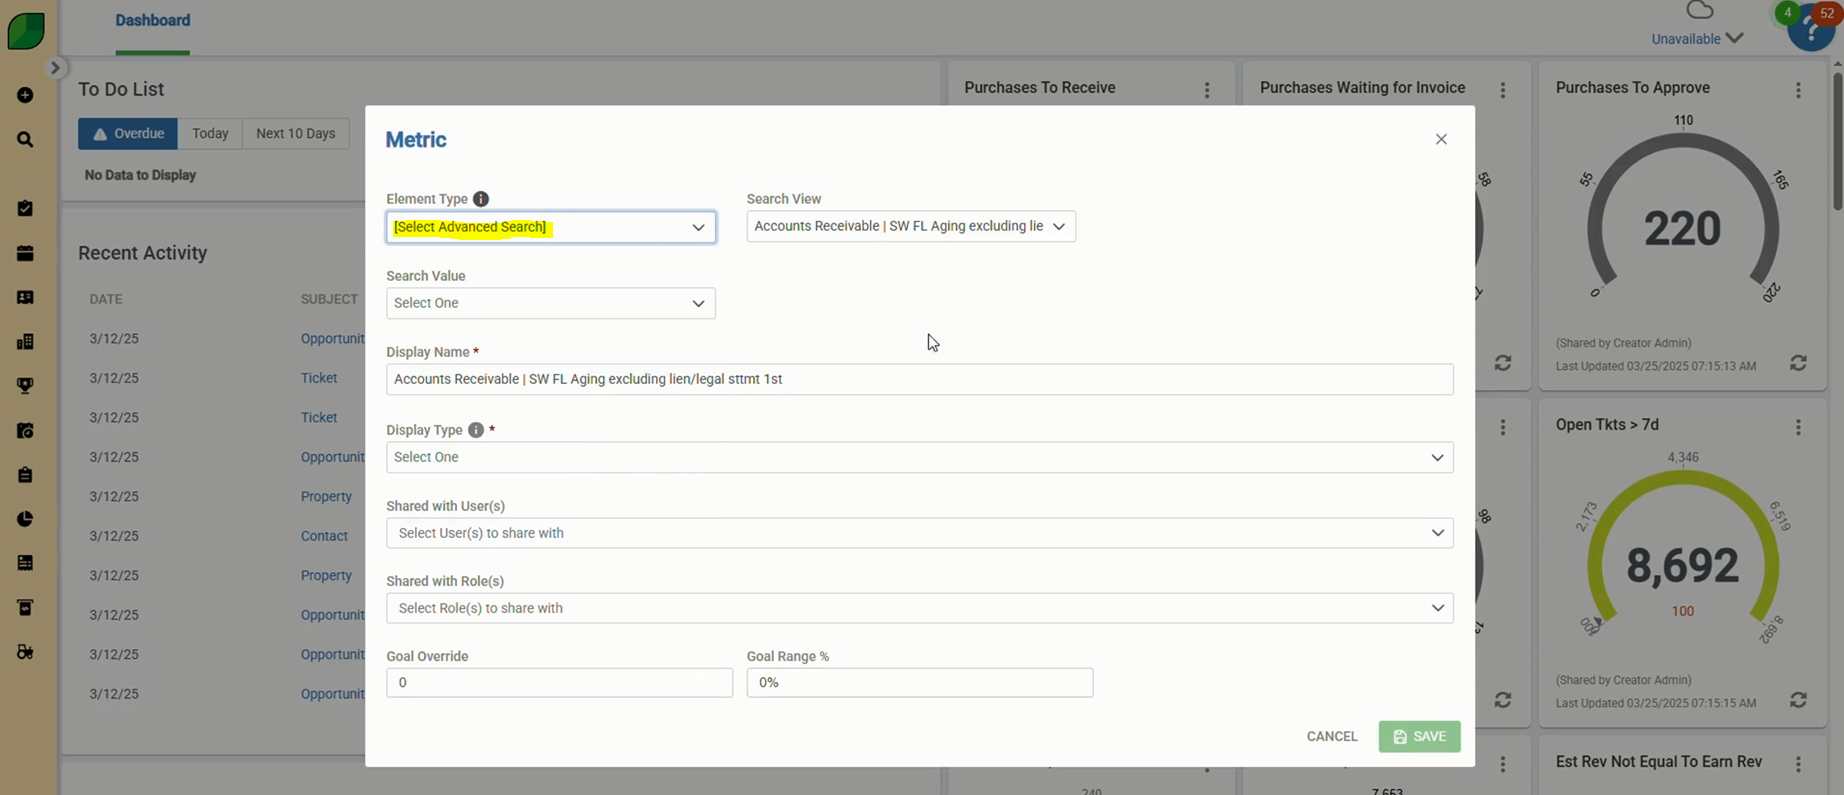
3. Choose “Advanced Search”
- In the Element Type section, select Advanced Search to refine your search results and filter data efficiently.
- Choose a saved list (e.g., work orders for the next 30 days).
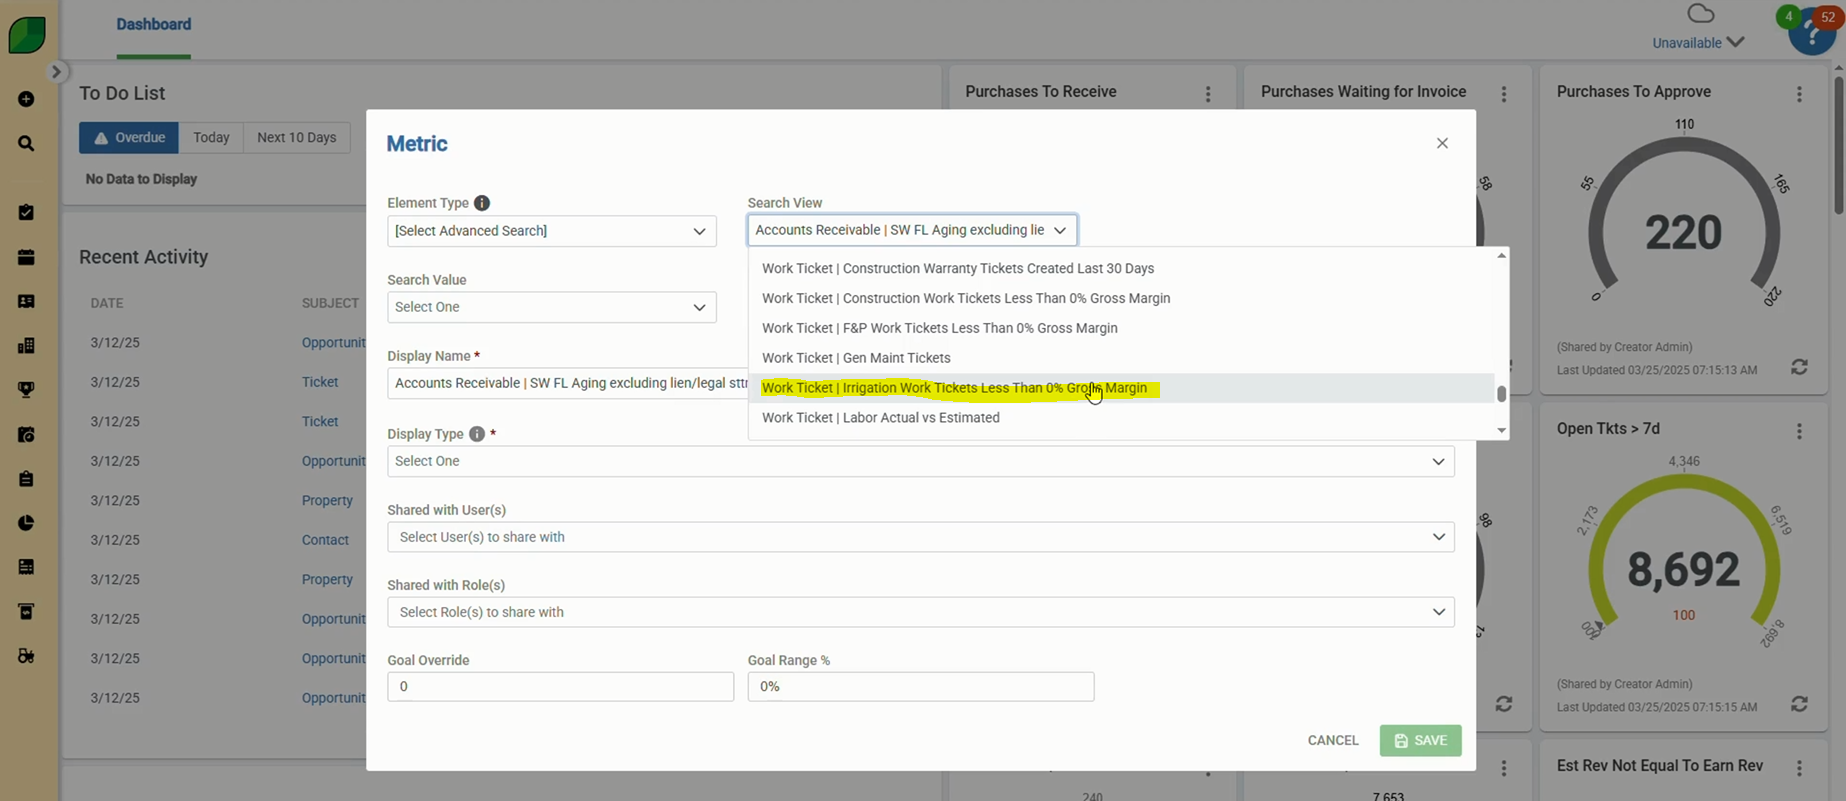
4. Apply the Search Filter
- Navigate to the Search View section in the settings.
- Select “Work Ticket | Irrigation Work Tickets Less Than 0% Gross Margin” to focus on underperforming tickets.
- Ensure this selection helps identify trends and analyze work performance effectively.
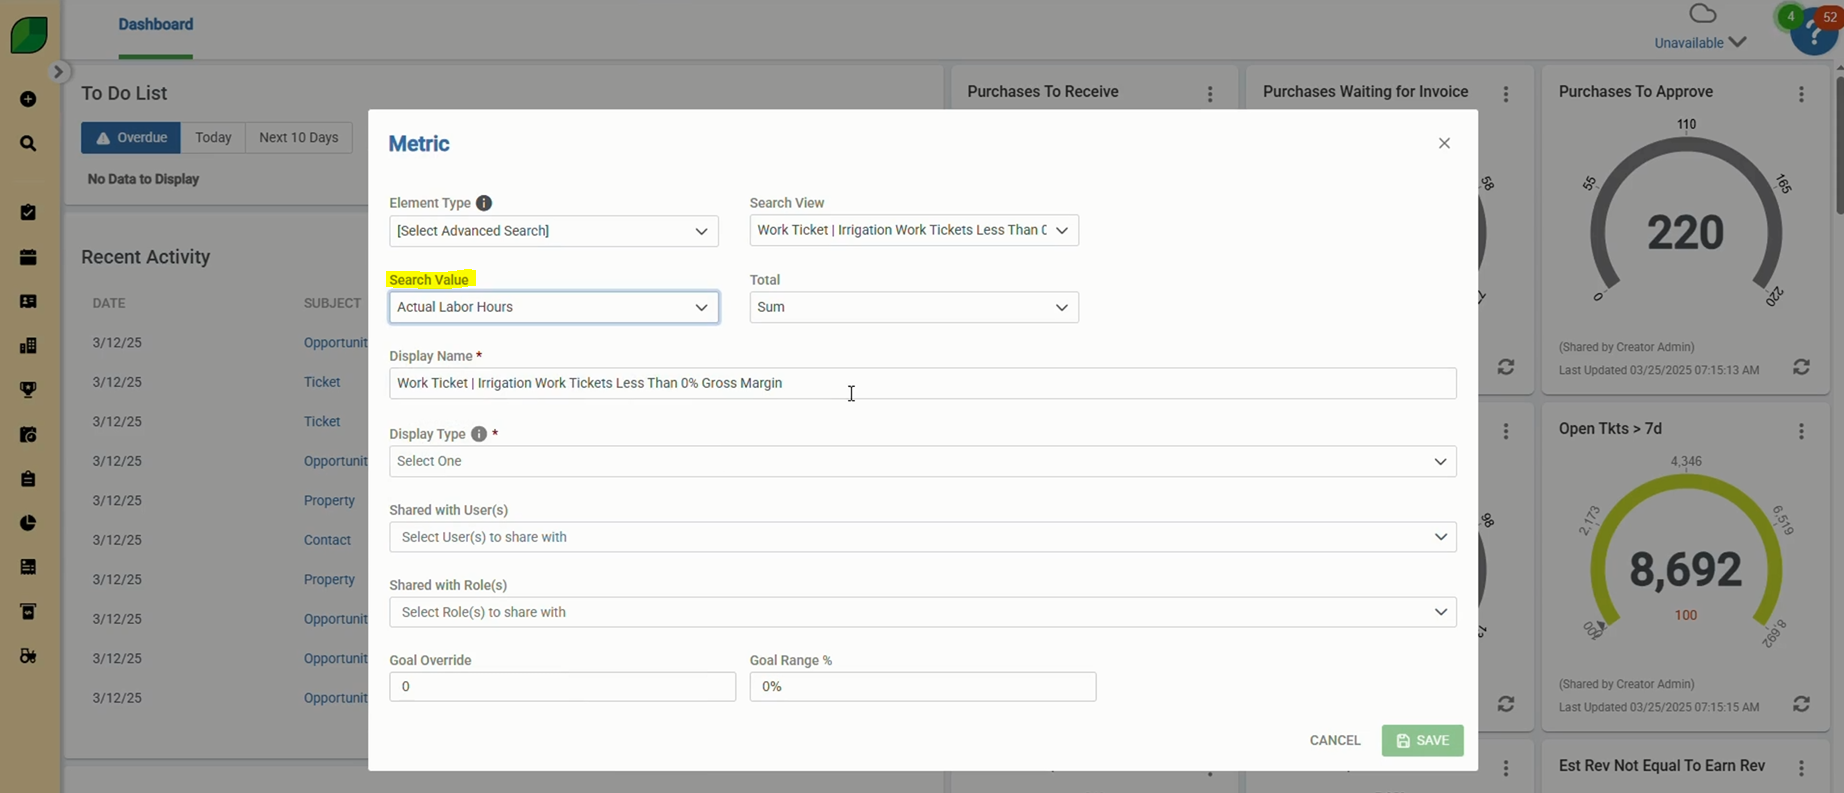
5. Define the Search Value
- Go to the Search Value section.
- Select “Actual Labor Hours” to track work effort and efficiency.
- Metrics can be configured to track record count, price, or other business values.
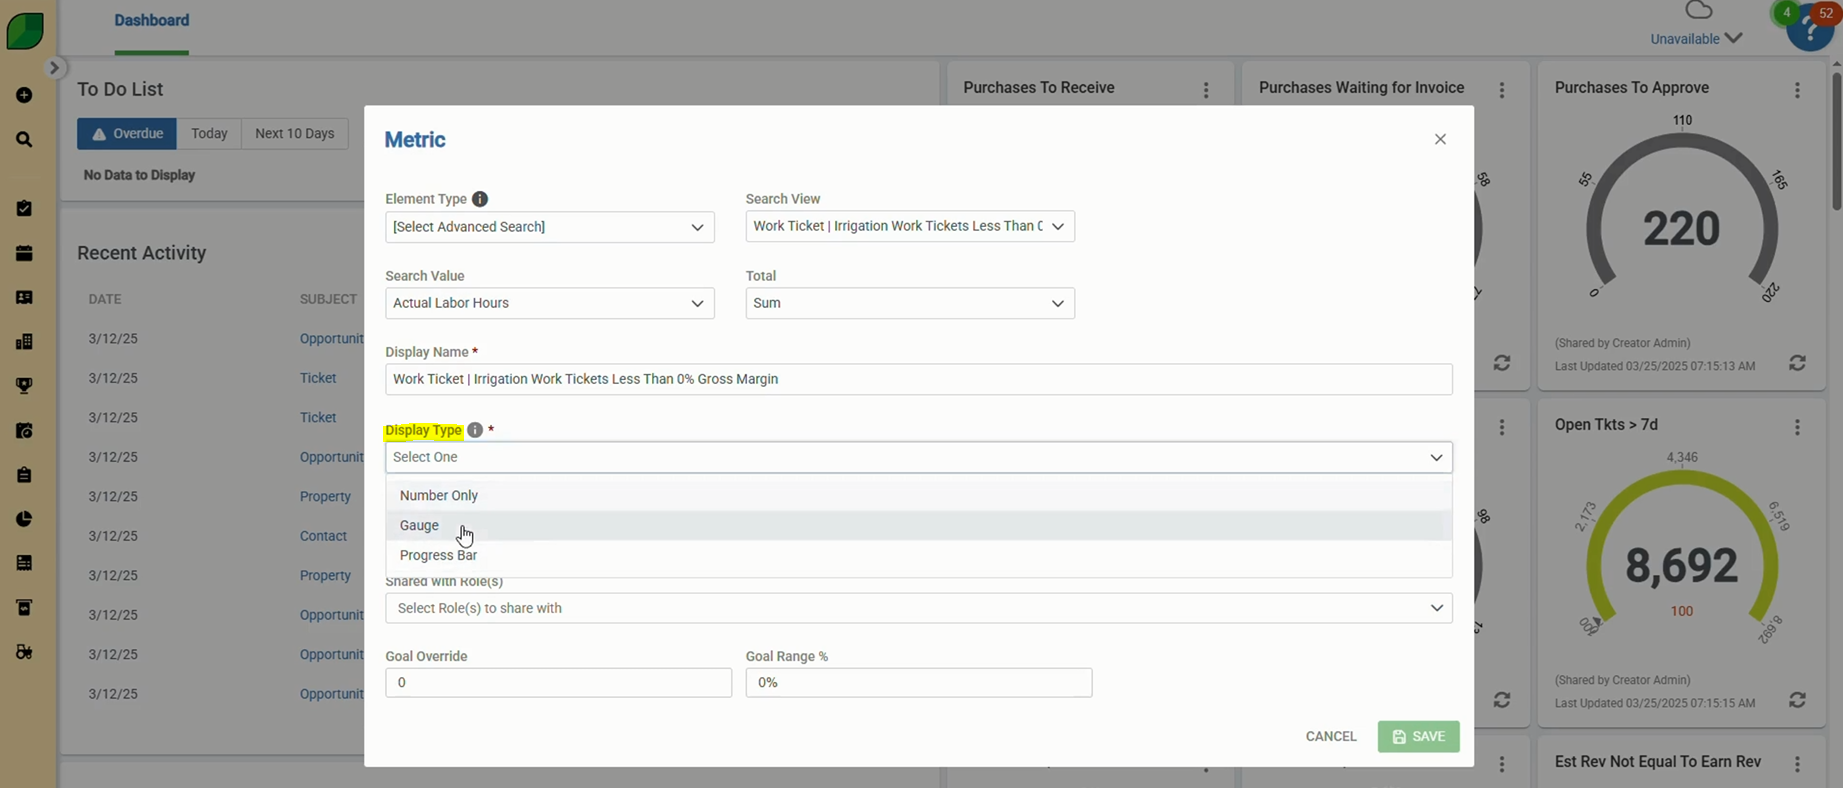
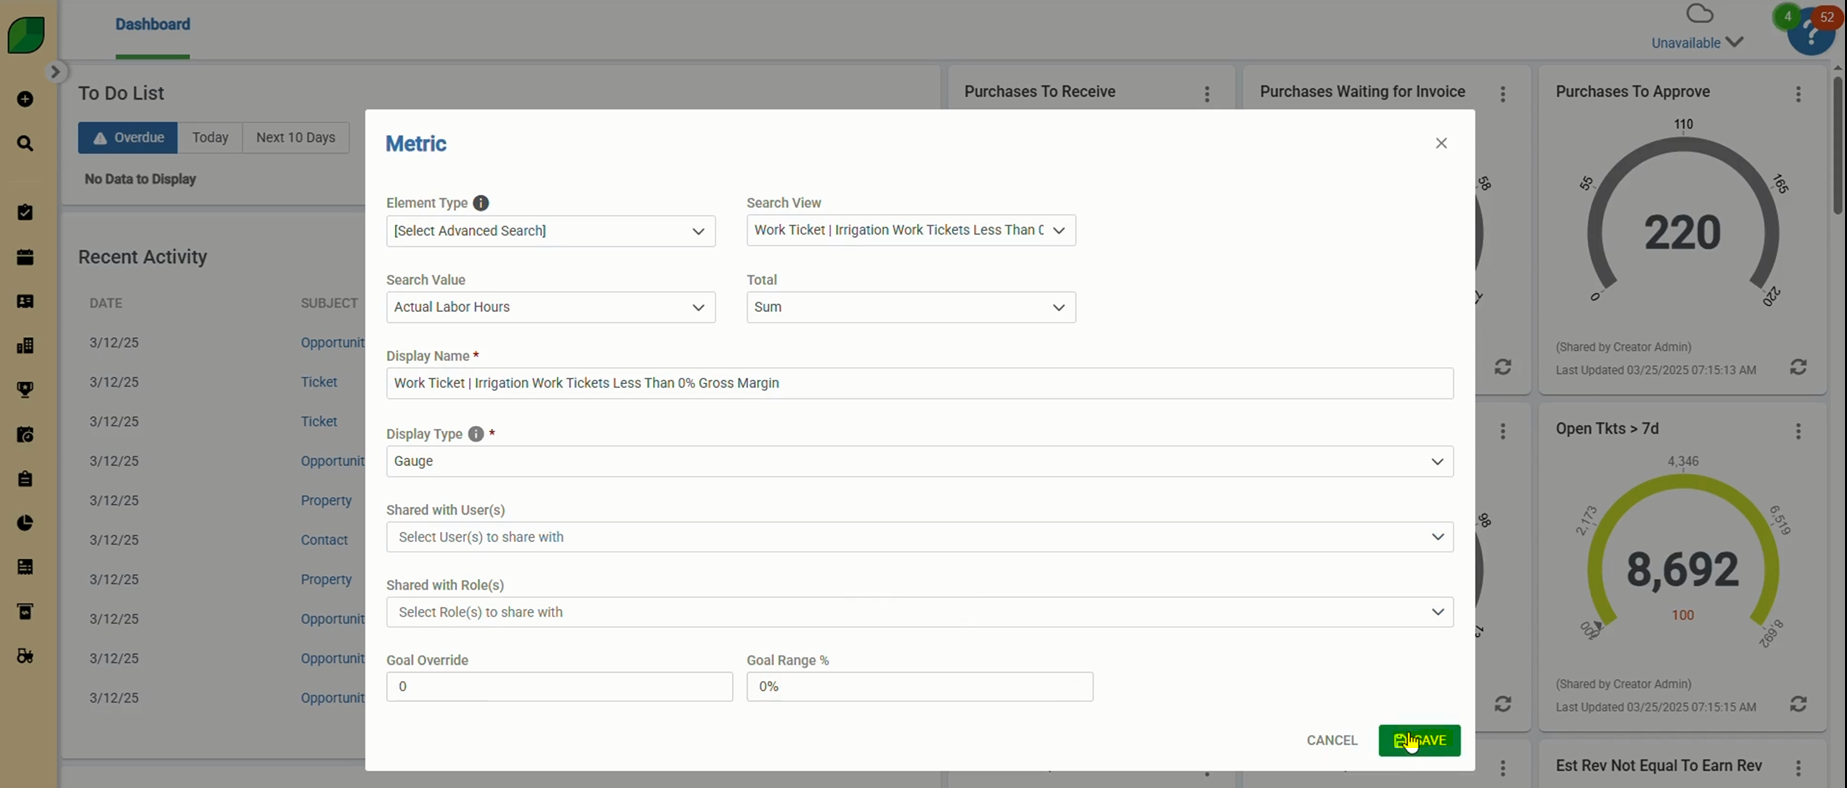
6. Set the Display Type
- Navigate to the Display Type settings.
- Choose from options like number, gauge, or progress bar to best visualize your data.
- A gauge chart is recommended for tracking key performance indicators (KPIs) at a glance.
7. Save and Review Your Settings
- Review all selected options to ensure accuracy.
- Click Save to finalize your metric setup.
- Your new metric will now be available for monitoring and analysis.
Editing Metrics
- Modifying Existing Metrics: Hover over the metric, select “Edit”, and update search values or goals.
- Adjusting Display Formats: Users can override ranges, set goals, and customize visual formats.
Best Practices for Managing Metrics
- Keep 8-10 metrics per role to avoid cluttering the dashboard.
- Collaborate with your team to decide which metrics are most essential.
- Click into metrics for deeper insights, similar to checking why a truck’s check engine light is on.
Following these steps ensures that your Aspire dashboard displays the most relevant and actionable data. By effectively navigating, editing, and creating metrics, users can optimize business performance and streamline decision-making.
Download a PDF version of the job aide here.